(This is part 2 in the No Time for Utopia series.)
Doom has always been a major attraction for some, perhaps even many people. There are whole subgenres of extreme (heavy) metal built on the aesthetics of death, doom, and decay.1 But “doom” in the form of extreme pessimism about the (near) future is also increasingly common in discussions about climate change and its effects. In Stages of the Anthropocene I tried to look into the more distant future. Whether what I found is an example of “doom” in this sense is debatable – at least I didn’t predict human extinction.2 Science doesn’t stand still, however, so I’ll probably need to update this long-term perspective soon. [edit (February 29, 2024) — I have, in fact, updated my “predictions” several times, and probably will keep doing so. At the time of this edit, my most recent prediction is that there is a 62% chance of exceeding 3°C of average global warming, which would be quite catastrophic.] One “detail” that needs more attention is the short (or near) term. Where-ever the Earth system is going on the longer term (i.e. in stages 2 and 3 of the anthropocene) depends largely on total CO₂ emissions in stage 1, and thus, we need more accurate scenarios for the near future – that is, for the coming decades to half century. But there are other reasons to desire such scenarios, of course. We – you, me, our children, and so forth – live now and not in the distant future, so the near term may be much more important to us than the long term.3
It’s not hard to find extremely pessimistic views about the near term. In a very influential (but unpublished) paper,4 Jem Bendell writes that:
Recent research suggests that human societies will experience disruptions to their basic functioning within less than ten years due to climate stress. Such disruptions include increased levels of malnutrition, starvation, disease, civil conflict and war – and will not avoid affluent nations.5
The statement is a bit ambiguous. If it is just a prediction of some disruption due to climate change, then it isn’t much of a prediction because that is already happening.6 In the context of the paper it appears to be intended as a warning for much more severe disruption, however. But while some of the research Bendell quotes does seem to suggest that societal collapse is likely within the coming half century or so, nothing in his paper supports the “less than ten years” prediction of severe social disruption (which isn’t mentioned before the conclusion either).7
Among the people quoted by Bendell is Guy McPherson who is relatively well known for making a considerably more extreme prediction: within a decade global society will collapse after which no-longer maintained nuclear power plants will meltdown leading to human extinction.8 McPherson’s “research” mostly consists of wild extrapolations based on inconclusive evidence, however, and the idea that nuclear meltdowns will lead to human extinction is very implausible.9
Another good (and very recent) example of this kind of near-term doom is a post on the Arctic News blog suggesting an 18°C rise by 2026.10 This number is the result of adding up the most extreme effects in various studies about climate change and ignoring the time scale of those effects, which illustrates a serious lack of understanding of climate science – that just isn’t how climate change works. Furthermore, the biggest effect is a supposed 8°C degree rise due to a disappearance of stratocumulus clouds if atmospheric CO₂ tops 1200ppm, but the paper from which that number was taken only suggests that stratocumulus clouds may disappear above the tropical oceans leading to such a temperature increase in those regions.11 Moreover, the research is based on a simulation model of clouds above a very small area of tropical ocean (for reasons of computational complexity), and it is not certain yet whether the extrapolation is valid. Much more research is needed about this topic to be able to judge its impact (which most likely is only relevant on the long term, and only in case of extreme CO₂ emission scenarios, moreover).
The pattern in these last two examples (and similar “doom and gloom” predictions) is typical: predictions of near-term doom are based on half-understood and misrepresented climate science, wild extrapolations, and unsupported leaps. So does that mean that all is well and we have nothing to worry about?
No, unfortunately that is not what it means. Because even if these predictions are built on quicksand, there may be other reasons to believe that widespread societal collapse is nearer than most of us would like to think.
Aside from methodological unsoundness, there is something else that these near-term doom scenarios have in common: they assume a very fast and catastrophic rise of CO₂ or – more often – methane in the atmosphere leading to exponential heating of the planet. The 18°C degree forecast by Arctic News is an extreme illustration hereof. The underlying assumption appears to be that human societies are very robust and that only extreme climate change can disrupt them, but that is a strange – and probably unwarranted – assumption.
It has become increasingly clear that many ecosystems are very fragile. In The End of Ice, Dahr Jamail uses a number of case studies to illustrate this fragility.12 Minute changes in temperature, sea level and acidity, humidity, and so forth have drastic effects on many ecosystems – sometimes even destroying them completely. Mankind is an inventive and creative species, but what reason do we have to believe that this is sufficient to make our societies much less fragile than this? What if the 18 degrees predicted by Arctic News aren’t needed, and 3°C or even 2°C warming is already enough to put us over the edge?
It is important to realize that any attempt to answer these questions does not belong to the field of climate science, but to the social sciences and humanities. Climate science can tell us what the likely effects are of a certain increase of atmospheric CO₂, but not what those effects in turn will do to human societies. And this is another point that many near-term doom scenarios have in common: they are not just built on bad climate science, but they (almost) completely ignore social science.
So then, how do we arrive at better, more realistic forecasts for the near future? Obviously, this is not a project that I can successfully carry out by myself, but I don’t have to either – parts of the work have already been done by others, and putting those parts together may already give us a clear enough picture to give rough and provisional answers to some questions. And hopefully, further research will gradually make the picture clearer.
climate change and natural disasters
I won’t make an attempt to give an overview of the current state of climate science here. Such an overview would be much too long for an article like this, but would also be somewhat redundant as David Wallace-Wells’s recent book The Uninhabitable Earth already does an excellent job at summarizing the main expected effects of climate change (and much more).13 (So, if you haven’t yet, read that book.) Nevertheless, there are a few things I must say about climate change itself before we can move on to its impact on human societies.
The first, and most obvious question is: How much can we expect global temperatures to rise in the coming decades? There are different ways of trying to answer this question, but the easiest is to extrapolate the graph of average global temperature of the past century. Unfortunately there is no single way of doing this, which leaves a lot of uncertainty, but on the short term the margins of uncertainty are relatively small.
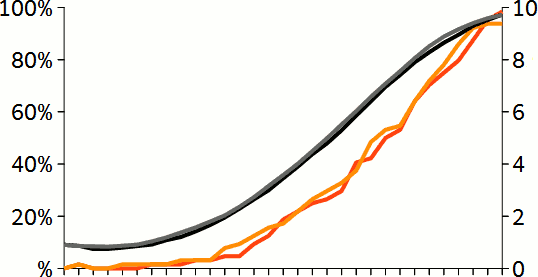
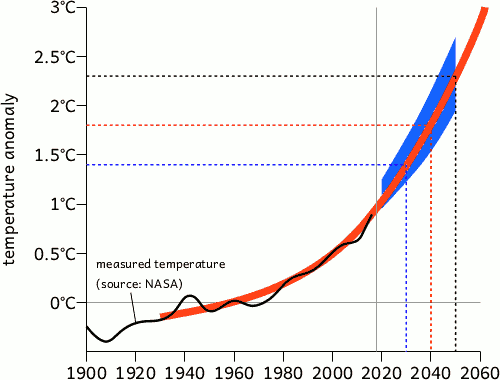 The black line in this graph shows “temperature anomalies” – that is, the average yearly temperature relative to the (estimated) pre-industrial average. In 2018 (the gray vertical line) it was approximately 1°C hotter. The thick orange lines looks like the most plausible extrapolation, which is supported by the fact that it runs right through the blue area, which is the 80% certainty range according to an article published in Nature in December 2018.14
There are no kinks in this line. The Earth system is complex and responds only slowly to changes in conditions, barring exceptional circumstances. Full-scale nuclear war, for example, would sharply bend the line downwards (for a while). And a sudden, explosive release of an immense amount of methane would sharply bend the line upwards. Almost all climate scientists agree that the second is extremely unlikely, if not impossible. How probable full-scale nuclear war is, is harder to predict.15 The line may gradually become steeper, however, due to methane releases or other positive feedbacks,16 but that matters little on the short term. The slow response of the Earth system also implies that even if we stop emitting CO₂ right now, it will continue to get warmer for a while anyway.
So, taking this into account, in 2030 (the blue dotted lines) it will be close to 1.5°C warmer than the pre-industrial average; in 2040 (the red dotted lines) it will be approximately 1.7°C warmer; and in 2050 (black dotted lines) it will be around 2.3°C warmer, although three decades is really already too long for reliable predictions given the many unknown (or insufficiently known) tipping points and feedbacks that start to play a role at this timescale. Again, this warming does not depend on further emissions – because of the slow response of the Earth system this is just the heating due to the CO₂ that is already in the atmosphere. And consequently, this heating is already inevitable.17
These temperature increases may not sound like much, but at 1°C various ecosystems are already collapsing,18 and 2°C is almost certainly sufficient to kill off approximately 99% of all coral reefs, which are – directly or indirectly – a major source of food for a substantial part of Earth’s human (and non-human!) population. But these apparently small temperature increases also matter directly for areas that are already very hot.
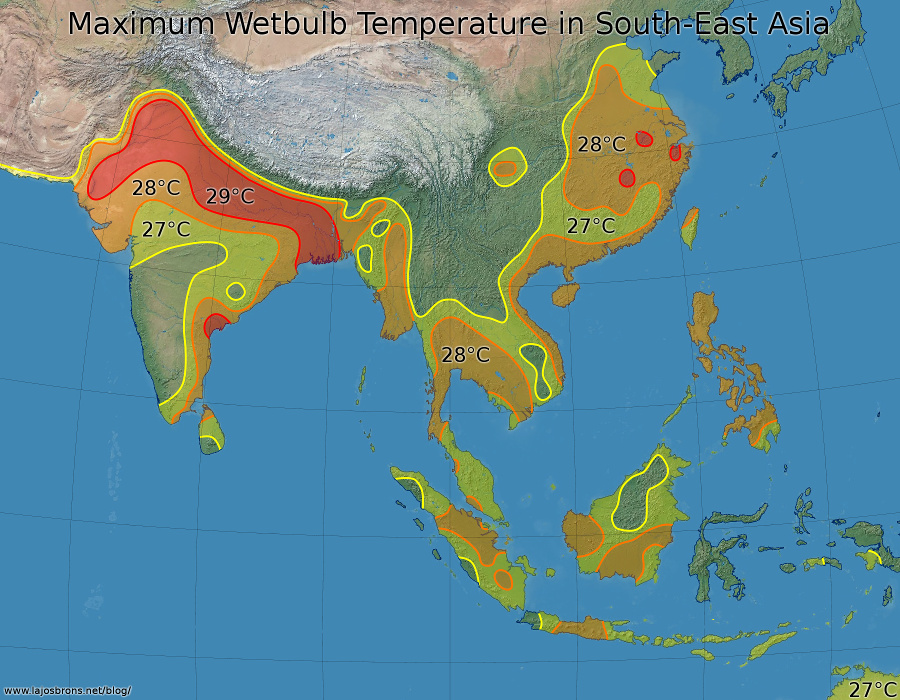
The most densely populated parts of China, India, and Pakistan, which together are home to more than one third of the world population, used to have maximum wetbulb temperatures of 28°C or even 29°C, as the following map shows:
 Wetbulb temperature is a measure that takes both heat and humidity into account. A wetbulb temperature of 35°C is deadly, but lower wetbulb temperatures can also increase mortality, and the higher the wetbulb temperature, the more people (and other mammals and birds) will succumb to the heat. The following graph shows three wetbulb temperature curves for different combinations of relative humidity and “dry bulb” air temperature (i.e. the temperature measured by a normal thermometer).
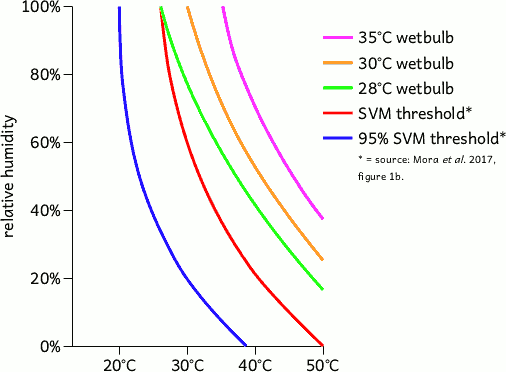 The pink line is the deadly 35°C wetbulb temperature line, but physical activity above wetbulb temperatures of 30°C and even 28°C can also be deadly, especially for the elderly and others who are less able to regulate their body temperatures. It is important to note that this refers to peak temperatures. At a wetbulb temperature of 35°C your body is cooked from the inside out (because you can’t get rid of excess body heat) in approximately 2 hours (which – rather obviously – will kill you). But it’s not just such brief exposures to extreme heat that can kill – long term exposure to heat can lead to kidney failure, for example,19 and heat stroke can kill without a deadly temperature spike.
Camilo Mora and colleagues analyzed 783 cases of excess mortality between 1980 and 2014.20 They identified a threshold, the blue line in the graph, that represents the approximate lower bound of these cases of excess mortality, but there also were many heatwaves to the right of that blue line that were not associated with excess mortality. These didn’t exceed the red line, however, so that line is the real “deadly” threshold. That is, any heatwave with a daily average temperature and humidity on or above the red line will in almost all cases cause substantial numbers of deaths.21 Note that this threshold concerns daily averages rather than peak temperatures (and that even the deadly peak temperatures need to last a few hours to have significant effects). Consequently, even more important than the daily peak temperature is the nightly temperature drop. If the temperature doesn’t decrease much below 28°C at night (or even lower if the day temperature is particularly high) there will be a significant increase in human (and other mammalian and avian) mortality.
During the heatwave that hit Australia in November 2018 (and after), temperatures over 42°C killed one third of the country’s population of spectacled flying foxes in just two days.22 There is no reason why the same couldn’t happen to human populations, unless they flee from areas that suffer most from deadly heat waves before the necessary level is reached. Unlike bats and most other animals, humans tend to make a fuzz when large numbers of them are dying, however, and mortality rates don’t need to be in double digit percentages for that.
At 1.5°C above pre-industrial, India and Pakistan may experience heatwaves with a peak wetbulb temperature close to 31°C, and will experience many more heatwaves right of the blue – and even red – lines in the above graph. Such heatwaves will kill large numbers of people. How large is hard to say. The 2003 heatwave in France killed approximately 14.800 people, or 0.022% of the population, and that was only a fairly minor heatwave compared to what India and Pakistan (and a little bit later also China) will experience in 10 or 20 years from now. If heatwaves in that region one or two decades in the future are merely 5 times as lethal as the 2003 heatwave in France, then a single heatwave could kill close to a million people. And that’s just the direct deaths – it doesn’t include deaths caused by secondary disasters such as economic collapse and refugee flows (i.e. the aforementioned “fuzz”).23
A much bigger threat than heat is drought, however. Gustavo Naumann and colleagues estimate that two thirds of the world population will experience an increase of drought with warming, and the small difference between 1.5°C and 2°C will more than double the global average drought duration. Aside from some small parts of the tropical rain forests and most of the sparsely inhabited northern half of the temperate zones, almost all of the planet will suffer more, and more severe droughts.24 On the other hand, in another study some of the same others found that there is considerable uncertainty on the short term,25 which confirms the more general “prediction” of unpredictability. That is, with warming in most regions the climate becomes more erratic and more extreme – there will be more and more sever droughts (as well as more storms, floods, and so forth), but where exactly is exceedingly hard to predict. (Many of the same authors were also involved in a useful technical report on drought risk by the Joint Research Council of the European Commission.26) Despite the uncertainty, there appears to be broad consensus that many of the current drying trends will continue. The Middle East and Central America will continue to dry out, for example, and so will much of the Mediterranean, parts of the United States and China, and so forth. And many areas (including these) will be hit at least once every decade by a drought so severe that these were – until recently – thought of as 100-year-droughts.27
Drought reduces available water, which is a serious problem because drinking water supplies are already stretched to (or over) their limits in very many areas,28 but at least as problematic is the effect of drought on agriculture and food supply. Unless a country is rich enough to import the food it needs, drought leads to hunger. And, rather obviously, the ability to import food doesn’t just depend on the wealth of the country experiencing crop failure, but also on supply – the more widespread drought and crop failure, the smaller the supply (and the higher the prices). There will be a point in the future at which countries won’t be able to import the food they need because no other country has a surplus to trade away. How far in the future is hard to predict – it may be anywhere between a decade and half a century, or if we’re very lucky, even later. If it would be just drought that destroys harvest global food shortage due to widespread natural disaster would probably be in the distant future, but the opposite of drought, excessive rain followed by floods, will also become more frequent in some areas (and some parts of the globe will experience both: going from one extreme to the other and back), and although the effects of floods tend to be more geographically concentrated, excessive rain can be as devastating for agriculture as the opposite.
Heatwaves, droughts, and floods are examples of types of disasters that are already becoming more common and that trend will continue. The same is true for storms, hurricanes, and typhoons, for example. These too are getting stronger and more frequent (largely due to higher ocean surface temperatures) and will continue to do so. It is this kind of effects of climate change that matters most on the short term: the increasing frequency and severity of “natural” disasters.29
unrest, refugees, and other social effects
Natural disasters have social effects. In addition to those there are also endogenous processes of social change, and the two kinds of changes and effects will probably interact, but let’s focus on the social effects of the increasing frequency and severity of natural disasters first.
On the longer term, climate change makes parts of the globe that are now densely inhabited unsuitable for agriculture and/or uninhabitable due to extreme heat or drought. Most of these changes take at least half a century to enfold, however, so they are of limited relevance for the short term. As already pointed out a few times, what matters on the short term are natural disasters.
Natural disaster come in roughly two kinds. The first kind causes lots of damage in a relatively small area, wiping out infrastructure, buildings, and farms, but causes few casualties. Most storms (including hurricanes and typhoons) and most floods belong to this category: their damage tends to be concentrated, but in that area the damage can be immense, and while they produce significant numbers of evacuees or refugees, these can in most cases be accommodated in nearby unaffected (or lesser affected areas).30 Nevertheless, while the socio-economic costs of such “type 1” disasters are relatively small for larger countries, when their number increases, they eventually become more frequent than the country can handle. Instead of helping the evacuees and repairing the damage, affected areas (and their populations) are then abandoned.
The second kind of disaster is muss less geographically concentrated, causes little damage to infrastructure, but produces many more casualties and refugees. Droughts belong to this category. Heatwaves may join this category as well, but thus far people don’t flee heatwave-affected areas (or at least not for that reason). Whether this changes when heatwaves become more extreme and more deadly remains to be seen. People tend not to flee until they see a direct threat, and if heatwaves are not perceived as sufficiently threatening, they might just stay put until they die or until other factors push them to flee.
These two kinds of disasters cause two kinds of social pressures. Type 1 causes a gradually increasing pressure due to a gradual increase of storms, floods, and similar “local” disasters. Unless a state has unlimited means to mitigate the effects of such disasters, sooner or later the compounding social and economic damage (refugees/evacuees, loss of economic activity, and so forth) will reach a boiling point. How far in the future such boiling points are is hard to say – there are too many unknown (or insufficiently known) variables determining this, and it probably differs from country to country.
While type 1 causes a gradually increasing social pressure, type 2 causes shock waves. How severe these shock waves are depends very much on the capacity of a state to (appropriately) respond to such disasters. The primary effects of droughts are crop failures and insufficient supply of drinking water. Other large scale (i.e. type 2) disasters are also likely to cause (more or less severe) food shortages. Hence, the main problem is food scarcity. In a rich country that is largely dependent on imported food (or that can import food when needed) a major drought or similar kind of disaster will cause economic stress, but is unlikely to have serious secondary effects. This is very different in a country that depends on its own food production and that doesn’t have the capability of importing food and/or distributing it among the affected population. There food scarcity leads to hunger and/or violent unrest.
The link between food scarcity and violent unrest is somewhat unclear, unfortunately, which is largely due to the effects of various intervening variables and other complexities. Benjamin Jones and colleagues have shown that state vulnerability, which co-determines the state’s capability to respond to disaster, plays a key role,31 and several studies pointed out that food prices are an important intervening variable between scarcity and unrest.32 Furthermore, Dan Braha has shown that there are important effects of contagion in civil unrest – that is, unrest can spread between adjacent areas and/or between areas that have close ties for other reasons,33 which complicates both the prediction of violent unrest and the study of its causes. Regarding the latter, Marco Lagi and colleagues argue, for example, that food riots in the last two decades coincide with peaks in food prices (which are themselves partially the result of speculation on food prices).34 While the relation is plausible (and is also supported by other research), contagion undermines the statistical support for this relation (in Lagi et al.’s study) because if the various food riots are partially due to contagion, then those are not independent cases. Rather, then there are effectively only two cases: one cluster of related riots at one peak in food prices, and another cluster of similarly related riots at a second peak.
Moreover, food scarcity is not the only climate-related (indirect) cause of unrest – heat can also play a role, for example – adding another complication to studying the relation between food scarcity and violence. In predicting future violent unrest this complication is less serious, however. Both drought and heat lead to an increase in civil unrest – how much each of the two contributes to that increase in unrest is less important than the (total) increase itself.
Gary Evans recently published an important overview of behavioral impacts of climate change, discussing the effects of extreme weather, drought, heat, and displacement resulting therefrom, on mental health and social interaction.35 Stress, depression, PTSD, anxiety, and increased family tensions are all expected to increase, but perhaps most importantly, heat leads to higher levels of aggression. This link was also confirmed in a study by Solomon Hsiang and colleagues.36 They found that for every temperature increase in a region equal to the standard deviation of the temperature in that region, interpersonal conflict increases by 4% and intergroup conflict by 14%. Their (outdated!) climate change map (figure 6) shows that large parts of South and East Asia and Africa are expected to have temperature increases by 2050 of at least 4 times the (regional) standard deviation, which would imply almost 70% increases in intergroup violence.37 It is not immediately clear what that means, however. Take southern China, which is one of the regions in this category, as an example – What does a 70% of intergroup violence in that region mean? Does it even have any intergroup violence to speak of right now? If not, then a 70% increase of nothing is still nothing. Or is it a 70% increase of some underlying tendency to intergroup violence that isn’t presently leading to actual violence, but that may lead to violence if it increases? (Which would raise a whole bunch of follow-up questions. How do you even measure such an invisible, underlying tendency?)
Despite all these uncertainties, what is quite clear is that climate change-related disasters will produce growing numbers of evacuees and refugees (and the difference between those is merely one of the nature and extent of help and assistance offered to them) and increasing stress and violence including violent unrest. And what should also be clear is that such violence leads to a further increase in the number of refugees.38 Estimates of the total number of refugees vary widely, but are generally in the range of several 100s of millions by 2050.39 Such numbers tend to overlook various feedback effects, however, and therefore, probably significantly underestimate the extent of the problem.
other social and economic problems
In addition to the stress caused by climate change, climate change-related disasters, and climate refugees, there are also other, more “endogenous” factors that may break societies, or at least play a role in societal collapse. Most of these have directly or indirectly to do with economics, and thus with neoliberal capitalism, the dominant political and economic system.
According to Wolfgang Streeck, capitalism is “dying, as it were, from an overdose of itself”.40 The neoliberal overdose and consequent lack of res- and constraints leads to “five systemic disorders”: “stagnation, oligarchic redistribution, the plundering of the public domain, corruption and global anarchy”.41 Many of Streeck’s “disorders” are directly related to the parasitism of the finance, insurance, and real estate – or FIRE, for short – sector.42 Excessive debt and rent extraction transform vibrant economies into “debt zombies”.43 Oligarchic redistribution is really another word for rent extraction and is the main cause of the concentration of wealth in the hands of ever fewer people. The plundering of the public domain is both a way of rent extraction and the consequence of the resulting impoverishment of the state. And so forth.
The two roots of the problem are rent extraction and debt. Rent extraction is the use of power or privilege to exhort fees above the value of some good. This includes interests, land and house rent, patent fees, and much more. In all of these cases, ownership or some other right is (ab)used to make people pay without doing or making anything in return. Rent extraction was considered problematic by classical economists (including Adam Smith, for example), but was brushed under the carpet by mainstream, neo-classical economists. The effect of rent extraction is a gradual enrichment of “rentiers”, who invest their profits in such a way that they continuously increase their rent extraction, thus leeching off the rest of society. This is the FIRE sector. The FIRE sector makes almost no useful contribution to society, but rather, sucks the life force out of it. (I’ve written about this before in Rent, Debt, and Power, so if you want to know more, then I recommend that you read that article.)
Excessive rent extraction gradually makes the rest of society (including the state) indebted to the rentier class or – in modern capitalism – to the FIRE sector. Excessive debt leads to a debt crisis. When the sum of debts of households and industry together is approximately 150% or more of GDP, an economic crisis is almost inevitable, although it can be postponed for a while.44 Historically, such crises were resolved by debt cancellations and/or bankruptcies.45 However, in the 2008 “Great Recession”, there was no debt cancellation or wave of bankruptcies alleviating total debt. (People went bankrupt, of course, but the effect thereof on the debt level was negligible.) Instead, the FIRE sector (which controls much of the state either directly or indirectly)46 was bailed out and nothing changed. Consequently, the debt level remained high. Currently it is well over 150% in most countries, and the next major economic crisis will, therefore, probably hit the world economy soon. But this time, states may lack the funds for another bailout. Or if they find them, the austerity necessary to fund those bailouts (which do nothing for the economy and only enrich the rich) will lead to a significant increase of civil unrest in many countries.
The parasitism of the rentier class – especially in the present context – reminds of a rather elegant computer model developed by Safa Motesharrei, Jorge Rivas, and Eugenia Kalnay called “HANDY” (short for “human and nature dynamics”).47 Based on a review of the literature on 23 historical societies that have collapsed, they identified two key features: (1) “the stretching of resources due to the strain placed on the ecological carrying capacity”, and (2) “the economic stratification of society into Elites and Masses”.48 While the first is of obvious relevance in the context of societal collapse due to climate change, the second is more relevant to this section.
Motesharrei and colleagues built a computer simulation in which a number of parameters can be changed to test effects on sustainability and collapse of societies. Running that model numerous times with different parameter settings suggests that there are two basic types of societal collapse that are related to the aforementioned two key features. In case of “Type-N collapse” natural resources are depleted until society collapses. Depending on the extent of depletion, there may be cycles of prosperity, overshoot, collapse, and revival, or collapse may be irreversible. (Currently, we are heading for the second.) The other type of collapse is “Type-L collapse” in which exploitation of the masses (or “Commoners”) by the elite (that is, socio-economic inequality) becomes so extreme that the masses are no longer able to support themselves.49 Interestingly, in the various runs of the simulation, they found that under conditions of socio-economic inequality, “collapse is difficult to avoid”.50 In case of depletion of natural resources in combination with socio-economic inequality (much like the current situation), they observe that in their model:
the Elites – due to their wealth – do not suffer the detrimental effects of the environmental collapse until much later than the Commoners. This buffer of wealth allows Elites to continue “business as usual” despite the impending catastrophe. It is likely that this is an important mechanism that would help explain how historical collapses were allowed to occur by elites who appear to be oblivious to the catastrophic trajectory (. . .). This buffer effect is further reinforced by the long, apparently sustainable trajectory prior to the beginning of the collapse. While some members of society might raise the alarm that the system is moving towards an impending collapse and therefore advocate structural changes to society in order to avoid it, Elites and their supporters, who opposed making these changes, could point to the long sustainable trajectory “so far” in support of doing nothing.51
In a historical study on inequality, Walter Scheidel argued for something like the converse of Motesharrei and colleagues’ finding.52 That is, from the spread of agriculture onward, societies have had a tendency to gradually become more unequal until violence – often extreme violence – or an apocalyptic epidemic acts as “great leveler”. War, revolution, epidemics, or societal collapse reduce socio-economic inequality. And importantly, nothing else does. Only extreme violence (or an apocalyptic epidemic) substantially reduces inequality. According to Scheidel the historical evidence is insufficiently clear-cut to support the other direction, but the research Motesharrei and colleagues quote as well as their computer simulation strongly suggest something like that. That is, inequality leads to collapse, and that collapse often involves violence, death, and massive suffering.
In addition to the closely related problems of rent extraction, debt, and socio-economic inequality, neoliberal capitalism is or will be confronted with another problem. Capitalism needs economic growth. Without growth, crisis ensues. A growing number of people now argue for “degrowth” or a steady-state economy, but the more economically literate among them realize that a growth-less economy cannot be a capitalist economy. As Giorgos Kallis and colleagues argue in a recent review of research on degrowth: “Recession and depression are possible within capitalism; degrowth is probably not.”53 Under capitalism, a lack of economic growth leads to unemployment, crisis, stagnation, poverty, and possibly ultimately, collapse. It is not self-evident that economies can continue to grow, however, even if we ignore the climate crisis.
Economic growth is an increase in the total production and consumption in a county, measured in the market prices of the goods produced and consumed. If a population doesn’t grow, the only way the economy grows is if that population becomes more productive – that is, if they produce (and consume) more and/or more valuable goods per person. Productivity growth is in almost all cases achieved by substituting energy as an input in the production process for labor. Thanks to technological innovation, some production process becomes less labor intensive and more energy intensive. From the beginning of the industrial revolution, the source of that energy has been fossil fuels. There are, of course, other sources of energy, but their contribution is (and can only be) minimal. Economic growth depends on fossil fuels, and therefore, capitalism depends on fossil fuels.
So, as long as we can continue burning fossil fuels, the economy (and thus capitalism) is fine, it seems. (If we ignore the effects of climate change, of course.) But we do not just need to keep burning fossil fuels, because that would just keep the economy as the same level (i.e. not growing, and thus stagnant). We need to keep burning more and more every year. There is, of course, plenty of the stuff (even though burning all of it would make the planet uninhabitable54), but mere existence of a large enough supply is insufficient – what matters is whether burning it is economically viable. Often it is assumed that this just depends on the financial costs of mining and producing fossil fuels, but there are also costs in energy.
“Energy return on investment” or EROI measures the amount of energy necessary to obtain energy. If some source of energy has an EROI of 2:1 then for every unit of energy obtained, half a unit of energy must be invested. If a type of power plant has an EROI of 10:1 and there are 10 power plants of that type, then one of them is just running to keep the others and itself running. For an energy source to be economically viable (on a sufficiently large scale) it needs to have an EROI of at least 10:1. Fossil fuels have a higher EROI (and so does nuclear energy, but solar and wind energy do not, for example), but that EROI has been sharply declining, and it is likely that it will drop below a level that makes continued economic growth possible in the near future. In other words, even though there still are vast supplies of fossil fuels, we won’t be able to use these to keep our economies growing for much longer, and with an end of economic growth, stagnation follows.55
The last time the world economy suffered an extended period of decline and stagnation – during the Great Depression – fascism gained popularity in Europe, the US, and Japan (even though it didn’t manage to gain power everywhere). This was probably not a coincidence. And considering that there already is a rise of authoritarianism, nationalism, anti-scientism, and other aspects of fascism in very many countries, the prospect of economic stagnation is especially worrying.56 A (new/further) rise of fascism can only lead to an increase of international conflict, deepening economic crisis, a spread of war and other kinds of violence, and growing numbers of refugees.
Given these various problems – debt, rent extraction, inequality, the necessity and impossibility of continued economic growth, and the relation between stagnation and (proto-) fascism – even without the climate crisis, capitalism may not be able to sustain itself much longer. But capitalism is so entrenched in our economic and political systems and in our cultures, that an end of capitalism may very well lead to societal collapse – or something very much like it – by itself.
simulations
The aforementioned HANDY model wasn’t the first computer model simulating societies and their collapse. One of the first computer simulations was Jay Forrester’s model introduced in a paper and a book published in 1971.57 An improved and extended version of that model became the “World3” model, which was used for the predictions in Limits to Growth, and which was further updated and improved for later editions of that influential, but also somewhat controversial book.58 Forrester’s original model and the World3 model predicted global societal collapse around the year 2030, mainly due to depletion of natural resources and to pollution. The assumptions of the model underestimated the supplies of key natural resources and overestimated pollution, however, so – even though it seems that thus far we have been following these models’ predictions quite closely59 – it is unlikely that pollution will lead to the massive increase in mortality predicted for the 2030s.
Among the crop of more recent (and probably more realistic) models, another model worth mentioning – in addition to HANDY – is that developed by Jan Nitzbon, Jobst Heitzig, and Ulrich Parlitz.60 Like HANDY, their model combines the natural and socio-economic subsystems of Earth, but the foundations and structure of the model are very different. At its core, HANDY is an ecological model (ultimately based on predator/prey population interactions), while Nitzbon and colleagues’ approach is more economic than ecological. Furthermore, while key aspects of HANDY are carrying capacity and socio-inequality, this model focuses on the carbon cycle and flows of fossil fuel between nature and society. Nevertheless, despite these large differences, the predictions of the two models look very similar. Like HANDY, this model can result in three different states: oscillation (periodic collapse-like decline followed by revival), stability, and (fatal) collapse. However, under conditions of capitalism the first of these states turns out not to be possible and (fatal) collapse can only be avoided by significantly reducing the global demand for energy and extensive use of renewable energy sources.
Computer simulations like these are useful to better understand how variables interact in complex systems. If you look back on what has been covered in this article thus far then you’ll find a list of problems – heatwaves, drought, other disasters, refugees, civil unrest and violence, more refugees, debt, crisis, stagnation, and so forth – but relatively little insight on how these various problems hang together. Well, … disasters and wars produce refugees – that should be fairly clear – but there are (probably) other interactions between variables. And there are other questions that putting as much of this as possible in a computer model can help answer. For example, it isn’t clear which of these various problems are most damaging, or whether the greatest damage to society is done by big shocks or by a gradual increase of strain due to compounding “small” effects. So I decided to build a computer model in an attempt to get a better understanding of the problem we are facing. Like any model, it has its limitations, but let’s introduce the model first.
a non-technical description of the model
The world of the model consists of 64 regions in a 8×8 grid. There are no geographical barriers between adjacent regions. Every region has a population (including a tiny “refugee” population which includes evacuees and immigrants), an economy (i.e. a GDP), a civic unrest level, and a probability modifier for the aforementioned two kinds of disaster. (More about the latter below.) All of these can be set randomly or equally if desired, but in most simulations I chose to set them to mimic something like the actual geographical pattern of these variables in the real world. So, a region approximately in the middle, closest to Syria and Iraq in the real world, has a much higher unrest level and a higher chance of type 2 disasters (such as major droughts), for example.
Aside from these starting values, there are a few other variables that are exogenous (i.e. not determined by the model itself, but given). These are the base level of economic growth and the probability and severity of the two kinds of disasters (i.e. five variables in total). Steps in the model are one year, and all of these exogenous variables can change from year to year, so they are given by tables. They can be set flat – that is, without a change in economic growth and/or disaster likelihoods – or fluctuating, or steadily increasing, and so forth. In most simulations, I set the base economic growth level at 2.3% in the first year and declining by 0.1% per year after that, which is a very “conservative” or optimistic setting.61
Actual numbers of natural disasters, where they occur, and how serious they are is further affected by random numbers (from random.org). The following graph shows the indexed numbers of disasters of type 1 and type 2 in two representative simulations (a and b) at a linear, small yearly increase of the probability of disasters. The average of the first five years is the “index”, so numbers of disasters are given relative to that index and then multiplied by 100.62 (Or in other words, the average of the first five years is defined as 100 and all other numbers are given relative to that.)
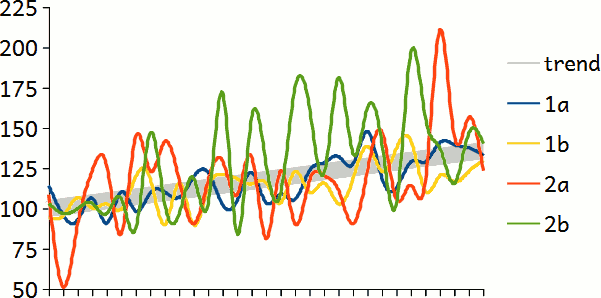 The green and red lines represent type 2 disasters such as droughts, major (deadly) heatwaves, and large scale floods. Such disasters are large, affect extended areas and very many people, and tend to produce substantial numbers of evacuees or refugees. (See also the section on natural disasters above.) Because these disasters are relatively rare, the lines representing their number fluctuate wildly. The blue and yellow lines represent type 1 disasters such as storms (including hurricanes and typhoons), floods, and other more local disasters. Such disasters tend to produce massive economic damage in (very) small areas, as well as some refugees/evacuees (but far fewer than the type 2 disasters). Type 1 disasters are (already!) very common and because their number is large, random effects cause far less fluctuation in these lines. The thick gray line, finally, shows the trend: a roughly 30% increase in both type of disasters over 30 years. This is probably an overly optimistic estimate – that is, the frequency of both kinds of disasters will almost certainly increase much faster than that in the coming decades.
Disasters have a number of effects. They cause economic damage, refugees (including evacuees), and deaths. The size of these effects is partially determined by the aforementioned exogenous variables determining the (annual) severity of disasters, as well as randomness and a number of model parameters. These model parameters can be set to make various kinds of damage (i.e. economic, mortality, refugees) larger or smaller. In most simulations, I set these parameters such that the various kinds of damage approximated what I could find about the damage of natural disasters in the past decades, but there is so much variability, uncertainty, and under-reporting, that these settings are probably still best qualified as a guess. (I’m not even sure whether they deserve the qualification “educated guess”.)
Economic damage can be repaired, but how much a region can repair depends on the size of its economy (and a further parameter).63 Some refugees are resettled (which partly depends on the extent of repairs), and a small percentage migrates to adjacent regions. How many migrate and where they go depends on the relative attractiveness of adjacent regions. If a adjacent region has less unrest, less disasters, and a better economy than the region where refugees are presently located, then some will migrate there. The larger the difference (i.e. the more attractive the adjacent region), the more will migrate.
The most important variable in the model is unrest, which is measured on a scale from 0 to 10. 0 is perfect calm – that is, everyone in that society is reasonably happy with the way things are and there is no dissent worth mentioning. If the number approaches 10 the country is in a state of civil war and/or complete societal collapse. For counting civil wars, I used 7.5 as a cut-off point: above that value a region is considered to have collapsed into civil war. There is a difference between 8 and 10, however, and that difference represents the scale and severity of civil war and/or societal collapse.
Unrest has effects similar to natural disaster, but the relation between unrest and the severity of effects is not linear. Full scale civil war (or complete societal collapse) is not 10 times worse than level 1 unrest (which is characterized by dissent and protest mostly). For this reason, the severity of the effects of unrest – before adding a bit of randomness – is proportional to the unrest level to the power of 3.64 And like natural disaster, the kinds of damage (i.e. economic, mortality, refugees) are further dependent on model parameters.
Unrest levels increase under the influence of economic stagnation or decline (i.e. insufficient or negative economic growth), natural disasters, and immigration of refugees (relative to the capacity of the host region to handle the immigration). As mentioned above, Dan Braha found that civil unrest is contagious – that is, it spreads to adjacent regions – and the model also takes this into account.65 While these effects all increase unrest, there are two effects that decrease unrest: economic growth, and “random” events (such as peace treaties, good governments, and so forth).
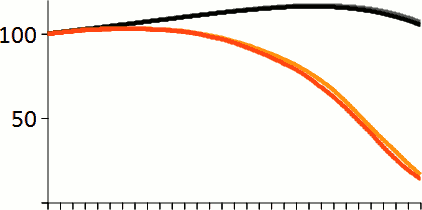
The global unrest level can be measured in two different ways: (1) as the percentage of regions at civil war (or in a state of societal collapse), and (2) as the average unrest level. The following graph shows both for the same time period and the same two simulations as those that produced the previous graph (about numbers of disasters). The orange lines show the percentage of regions in a state of civil war / societal collapse (left Y-axis). The black and gray lines show the average unrest level (right Y-axis). This graph is a fairly typical result. It shows a global breakdown of society within 25 to 30 years from now.
 Two other variables that reflect the spread of societal collapse are global population and global average GDP per capita (i.e. the state of the global economy). The following graph shows these two variables for the same two simulations. Black and gray lines represent the world population; orange lines represent GDP per capita. Both variables are indexed such that the starting years have the value of 100.
 The demographic subsystem of the model simulates birth rates, death rates, and migration. Each region has a refugee population and a non-refugee population. Birth rates for both populations (in each region) are dependent on GDP per capita (mimicking the real world relation between these two variables) – that is, poorer regions have higher birth rates. By implication, with economic decline, birth rates start to increase. Death rates are also dependent on GDP per capita (again, mimicking the real world relation between these two variables), but also by disasters and unrest (although only very high unrest levels result in significant mortality). Refugees have almost the same death rate (and a slightly higher birth rate) as host populations, as research has shown that the death rates of refugees tend to be very similar to the death rates of their host regions.66 As mentioned above, small percentages of refugees migrate to adjacent regions if those are more attractive, and depending on the level of disaster management, more or less refugees settle and thus become non-refugees (either in their home region or wherever the migrated to).
The main effect of different settings of the various parameters and exogenous variables is a change of the time scale.67 A slower increase in the frequency and severity of disasters postpones global societal collapse, and conversely, a faster increase brings it a bit closer (but settings have to be implausibly extreme to result in global societal collapse within less than 20 years). More severe economic decline also speeds up collapse. Continued high economic growth combined with no or only a very limited increase in natural disasters completely prevents widespread societal collapse, on the other hand, but unfortunately, that is a rather implausible scenario.68
some limitations of the model
The above graph shows that the world population keeps growing for another two decades and then starts to decline slowly.69 The continued growth for much of this period, as well as the very slowly decline in the latter part, is mostly due to the increasing birth rate. Only after a few decades, when the world is approaching global societal collapse, does the death rate overtake the increasing birth rate. The model does not take famine into account, however, which is one of its most important limitations. In the present situation, famines tend to be very local problems as much of the planet can import food in case local production is insufficient, but this won’t be the case in a world in which food shortages are no longer local but worldwide (and in which global trade is breaking down).
In case of a global collapse of industrial food production, famine will be widespread and devastating. In such circumstances – without oil for agricultural machines, without large-scale food processing industry, and so forth – Earth will be able to feed far less people. A very optimistic guess would be half the current world population, but in case of societal collapse, which would further devastate agriculture, other food production, and trade, it is likely to be much lower than that. The pre-industrial Earth had about half a billion human inhabitants,70 and it may very well be the case that that is the maximum number of people that the planet can feed in (and/or after) a state of global societal collapse.
Famine is not the only thing the model ignores: rent extraction, debt, and socio-economic inequality play no role in the model either, and neither does the rise of authoritarianism (including variants of fascism and jingoism), and all of these are likely to speed up collapse (see above). Perhaps the most important omission is trade, however.
The model effectively assumes that all regions are self-sufficient, but that is obviously not the case. Most real-world countries import the fossil fuels they need,71 for example, and immense quantities of various other commodities (electronics, cars, plastics, steel, chemicals, food, and so forth) are shipped around the world. Few countries are self-sufficient, and in most countries whole industries would shut down without global trade.
When a country collapses into civil war, trade with that country will almost completely stop (because it won’t produce enough anymore to export and won’t have a functioning internal market anymore for imports). This is not a problem for the world economy if it just affects a few countries, especially if those are on the periphery of the global trade network anyway, but the more countries or regions are affected, the more serious the effects on the world economy. Slowly the international trade network will start breaking down. Just some specific commodities will be affected at first, but the collapse of trade in those commodities will lead to the decline of industries depending on them, hastening economic decline elsewhere, thus creating a vicious circle of collapsing trade, economic decline, increasing civil unrest, and further collapsing trade. Because of this, the model probably underestimates the spread of collapse in later stages. Or in other words, the unrest curves shown before and repeated here should probably be much steeper in the right-hand part of the graph.72
This doesn’t necessarily imply that global societal collapse will occur sooner than predicted by the model, however, as I also think that the model exaggerates the extent and spread of civil unrest in the earlier stages. Hence, the beginning of the unrest curves should – probably – be flatter. If the predicted unrest curves are flatter at first and steeper later, it also become much harder to predict how close to the tipping point (i.e. the point where the curve changes from gently to steeply sloping upwards) and thus how close to global social collapse we are, but this is also very uncertain for another reason. As already mentioned above, the speed of collapse in the model depends entirely on the setting of various model parameters, and most of the settings used in most simulations are really just guesstimates. They are guesstimates by necessity, moreover, as we cannot run an experiment to figure out what these parameters should be. Well, … in a sense we are already doing that experiment, but we can do it only once, and when it is finished there probably won’t be computers to run simulations on anymore.
Hence, while global societal collapse is a virtual certainty in any scenario that even remotely resembles business as usual (I’ll turn to what is necessary to prevent global societal collapse – if possible – in a future article), it is very uncertain how far in the future that collapse is. Parameter settings that seem plausible to me suggest dates between 20 and 35 years from now, and there are other reasons to believe that this is about as much time as we have left – much faster is unlikely because the spread of cascading effects takes time and inertia slows many things down, and much slower is unlikely because the scale and extent of the various problems – so the model (and these settings) may be accurate enough to warrant some conclusions (in the next section). In addition to knowing the deadline for human civilization,73 it would also be “nice” to be able to recognize the aforementioned tipping point (i.e. the point where the curve changes from gently to steeply sloping upwards, and where global societal collapse becomes virtually unavoidable). The model cannot identify that point, however, but if I’d take a guess, then I’d say that when India collapses into complete chaos we have less than a decade left.
what does the model show?
As mentioned, the purpose of the model was twofold: (1) clarifying the relations and interactions between variables, and (2) determining whether big shocks or slow build-ups of compounding effects are more important. The model makes it fairly easy to test the latter: at any point an extra super-disaster, major economic crisis, or other kind of big shock can be introduced. It turns out that such shocks have only very minor effects, however. Of course, they have major effects in the region where they occur and on the short term, but the long-term global effects are almost negligible – even of very big shocks.74 And consequently, the model strongly suggests that it is compounding small effects that ultimately lead to global disaster. Civilization will – probably – not be destroyed by a few big disasters, but by very many small disasters – so many that they will gradually overwhelm the capacity to cope with them and slowly (at first, but much faster after a tipping point is reached) push us towards collapse.
The model further suggests that two factors play a major role in causing global societal collapse: refugees and economic decline. Disasters and civil wars produces refugees. Their numbers are small at first, but increase gradually (especially when new disaster damage is greater than the society’s capacity to manage or repair the damage). Refugees increase stress and unrest in their host society (which may be their home region), and the factors that produce refugees also produce economic damage. These effects make adjacent, less affected regions more attractive, leading to migration, but immigration (in those adjacent regions) increases stress and unrest there, especially if the number is large, and especially if those regions already had problems of their own. Slowly, but surely, numbers of refugees will exceed the capacity of societies to handle them. Some societies may break down just as an effect of a massive inflow of refugees.
The importance of refugees in the model wasn’t very surprising;75 the feedback effect created by economic decline did surprise me a bit, on the other hand. That there would be such a feedback isn’t surprising, but it turned out to play a much more important role than I expected. Having given the issue (much) further thought (after running these simulations) convinced me that the model is right in this respect, however. Disasters cause economic damage – not much if they are small disasters, but even a rich country like Japan or the United States cannot repair the damage caused by local disasters (caused by typhoons, hurricanes, floods, and so forth) if there are too many of them (and “too many” really is just a few more than we have now).
Gradually, the economic impact of disasters will start to build up and cause economic stagnation or decline. In a capitalist society, stagnation or decline causes unemployment, uncertainty, stress, and unrest.76 That increase of unrest, combined with other sources of unrest (such as disasters and contagion), causes further economic damage – small at first, but vast in case the unrest level leads to civil war. In most regions, the unrest levels are very low in the beginning, so economic decline by itself is nowhere sufficient to cause societal collapse or civil war, but combinations of problems will (eventually) push some regions over the edge, and that produces more refugees, more contagion, and more economic decline, and all of those spread to adjacent areas. This produces a vicious circle of economic decline causing unrest causing refugees causing unrest and further economic decline, and so forth. Furthermore, with economic decline, a region also becomes less capable of managing and repairing disaster (and unrest) damage, and of resettling refugees (or evacuees) and immigrants. This leads to a second vicious circle of economic decline causing more severe long-term effects of disasters (and unrest) causing more economic decline, and these two vicious circles interact with and reinforce each other. Given the importance of these feedback effects, the neglect of trade by the model (see previous section) becomes especially important: a collapse of trade will have serious economic impacts, and if economic decline plays such a central role in societal collapse, then a collapse of the global trade system will significantly hasten global societal collapse. (Which supports the suggestion that the unrest curve will be much steeper later on than the model suggests.)
In addition to these findings about “details”, there is another thing the model shows quite clearly, and that is, perhaps, its most important implication: No catastrophic climate change is necessary to destroy global civilization. Current trends and effects of climate change are – through some social feedback effects – already sufficient to lead to global societal collapse within half a century (and probably less).
Or perhaps, I should phrase this differently: the current level of climate change (including what is already locked-in for the coming decades even without further CO₂ emissions) is already catastrophic.
implications and (mal)adaptations
So, society is almost certainly going to collapse. Slowly, the frequency and severity of natural disasters will increase. On a global scale, these disasters are like sticking needles into an elephant – individually they don’t do anything, but at some point there are just too many of them. Disaster effects will gradually exceed what societies can handle. Slowly, but surely, refugee flows will become larger. The economic damage caused by disasters and increasing social stress and unrest (and by neoliberal capitalism itself) will set off a vicious circle of economic decline and increasing unrest. Drought, famine, endless flows of refugees, war, civil war, and so forth – all of them will increase – slowly at first, but faster and faster, until a tipping point is reached, and then the whole world will slip into chaos. Global trade will grind to a halt, societies will break down one after the other, collapsing into violent chaos. It is impossible to say how far in the future this global societal collapse will take place, but due to inertia and the slowness of various processes involved, it is unlikely to be much less than two decades. And because of the expected effects of climate change as well as various economic and other problems, it is also very unlikely to be more than half a century in the future. So that’s the window – 20 to 50 years – but based on everything written in this article, my guess for civilization’s demise is between 25 and 30 years from now.
What will be left of society after collapse will be entirely different from what most of us have ever experienced. Widespread famine will kill billions (or have already killed billions by then), and the violent struggle for survival will further devastate food production, leading to even more hunger. Without global trade most areas won’t have the fossil fuels needed to run power plants, factories, and transportation networks. Virtually all modern technology will be useless. Natural disasters will pound many areas again and again. Live will be “poor, nasty, brutish, and short”.77
There is some good news, however. If a global societal collapse occurs before 2050, and human CO₂ emissions thereafter are negligible (or close to negligible), which is a likely consequence of widespread collapse, then this radically changes the long-term scenario. In Stages of the Anthropocene I predicted that only a very small sub-arctic zone would remain inhabitable, and that this would be sufficient for a population of about 1% the size of the current world population. However, that prediction was based on an atmospheric CO₂ level of roughly 1000ppmv (before feedbacks). In case of global societal collapse before 2050 we will never reach that level, however. Instead, we’ll end up somewhere in between RCP4.5 and RCP6.0. That will still make the tropics uninhabitable, and it will still change southern Europe, Central America, and large parts of Asia into a desert and thus make most of the subtropics uninhabitable as well, but it will also leave a substantial inhabitable zone. After a new stable situation is reached (in 2000 years or so), Earth might even be able to feed up to half a billion people.
That’s the distant future, however, and it is of limited relevance to us and our children and grandchildren. What matters now is the nearer future. Jem Bendell coined the term “deep adaptation” for an attitude to climate change that takes the severity of our predicament seriously, and that tries to find a way to cope with and adapt to it.78 In my interpretation, deep adaptation includes two different kinds of adaptations: (1) adaptations to (try to) prevent (or at least alleviate) societal collapse, and (2) adaptations to societal collapse. I’ll discuss the first kind of adaptations in the next episode of this series, The Lesser Dystopia, but I want to say something here about the second.
There is a movement of individuals who believe that they can somehow prepare for societal collapse. Sometimes these individuals are called “preppers”. They build shelters, food storage facilities, and arm themselves, waiting for climate Armageddon.79 Such preparation is delusional, however – it is not an adaptation to societal collapse, but rather a maladaptation. Why this is the case was expressed quite nicely by Mark Lynas in his Six Degrees:
In a situation of serious conflict, invaders do not take kindly to residents denying them food: if a stockpile is discovered, the householder and his family – history suggests – may be tortured and killed, both for revenge and as a lesson to others.80
There is no way you can protect yourself, your family, and your food supply if society is collapsing around you. The only way to protect yourself is to protect your community – that is, to prevent your community and your society from collapsing. “Prepping” is not (deep) adaptation. There is no individual adaptation. We can only adapt together. And this applies to larger spatial scales as well. For regions, countries, or even continents the “prepper” recipe doesn’t work either – a country cannot defend itself against millions of refugees even if those refugees are armed only with sticks and stones. The choice is simple: going at it alone (either as an individual or as a country) is suicide, and therefore, either we adapt together, or we go down together.
Links to articles in this series:
No Time for Utopia – Series introduction. Against “ideal theory” and Utopianism.
On the Fragility of Civilization – (This episode.)
The Lesser Dystopia – What is necessary to avoid global societal collapse?
Enemies of Our Children – Who and what are preventing the necessary change of course?
The Ethics of Climate Insurgency – On violence as a means to prevent catastrophe.
The Possibility of a Revolution – Can a revolution establish the Lesser Dystopia?
The 2020s and Beyond – A scenario for the coming decades.
What to Do? – Some closing reflections on what we should and can do.
If you found this article and/or other articles in this blog useful or valuable, please consider making a small financial contribution to support this blog 𝐹=𝑚𝑎 and its author. You can find 𝐹=𝑚𝑎’s Patreon page here.
Notes
- The sub-subgenre of “funeral doom” within the doom metal genre is, perhaps, the best (and most enjoyable) example.
- But what I predicted might actually be worse.
- This is debatable, actually. As Samuel Scheffler has pointed out, our value systems depend largely on the belief in a future for mankind. If mankind has no future almost everything loses its value – at least for most of us. See: Fictionalism – or: Vaihinger, Scheffler, and Kübler-Ross at the End of the World, and: Samuel Scheffler (2013), Death and the Afterlife (Oxford: Oxford University Press) .
- Bendell’s paper was reviewed and rejected by the reviewers. The rejection wasn’t based so much on a lack of merit of the paper, but because it undermined the basic premises of the field of the journal it was submitted to (i.e. sustainable management). In my opinion, the paper should have been published. Its rejection is indicative of academic inertia and cowardice.
- Jem Bendell (2018). Deep Adaptation: A Map for Navigating Climate Tragedy, IFLAS Occasional Paper 2.
- California wildfires, drought in the middle east, more and stronger hurricanes, floods, excessively cold winters, and other extreme weather are all partially due to climate change.
- Despite this critique, I agree with most of what Bendell writes and consider his paper one of the most important recent contributions to the literature on climate change.
- See: https://guymcpherson.com/.
- Most meltdowns will be contained in the reactor vat. Those that breach the reactor vat will cause major nuclear accidents, but the only effect thereof is an increase of cancer in the direct environment of the nuclear power plant (and a tiny little bit at greater distances). The impact thereof is negligible on a global scale (that is, on a scale relevant to human extinction), however, even if very many of the 400-or-so active nuclear plants experience major nuclear accidents.
- http://arctic-news.blogspot.com/2019/02/a-rise-of-18c-or-324f-by-2026.html
- Tapio Schneider, Colleen Kaul, & Kyle Pressel (2019). “Possible climate transitions from breakup of stratocumulus decks under greenhouse warming”, Nature Geoscience 12: 163-167.
- Dahr Jamail (2019). The End of Ice: Bearing Witness and Finding Meaning in the Path of Climate Disruption (The New Press).
- David Wallace-Wells (2019). The Uninhabitable Earth: A Story of the Future (Allen Lane). The American edition of this book (published by Tim Duggan) has a different subtitle, “Life after Warming”, but the same content.
- Wangyang Xu, Veerabhadran Ramanathan, & David Victor (2018). “Global Warming Will Happen Faster than we Think”, Nature 564 (6 December 2018): 30-32.
- On the effects of nuclear war, see: Crisis and Inertia (3) – Technological Threats and Crises.
- See: Stages of the Anthropocene.
- Although we can temporarily mask it by means of geo-engineering or nuclear winter.
- See, for example: Jamail (2019). The End of Ice.
- Oriana Ramirez-Rubio et al. (2012). “An Epidemic of Chronic Kidney Disease in Central America: An Overview”, Journal of Epidemiology and Community Health 67.1: 1-3.
- Camilo Mora et al. (2017). “Global Risk of Deadly Heat”, Nature Climate Change 7: 501-6.
- They also predict that under the RCP8.5 scenario large parts of South Asia, Africa, and South America will be subject to deadly heat most of the year in a century from now, which means that these areas will be uninhabitable.
- https://www.bbc.com/news/world-australia-46859000
- On the threat of heat waves, see the chapter “Heat Death” in: Wallace-Wells (2019), The Uninhabitable Earth, as well as: Camilo Mora et al. (2017), “Global Risk of Deadly Heat”, Nature Climate Change 7: 501-6; Ethan Coffel, Radley Horton, & Alex de Sherbinin (2018), “Temperature and Humidity Based Projections of a Rapid Rise in Global Heat Stress Exposure during the 21st Century”, Environmental Research Letters 13.14001; David Newth & Don Gunaskera (2018), “Projected Changes in Wet-Bulb Globe Temperature under Alternative Climate Scenarios”, Atmosphere 9.187; Simone Russo, Jana Sillman, & Andreas Sterl (2017), “Humid Heat Waves at Different Warming levels”, Nature Scientific Reports 7.7477; Eun-Soon Im, Jeremy Pal, & Elfatih Eltahir (2017), “Deadly Heat Waves Projected in the Densely Populated Agricultural Regions of South Asia”, Science Advances 3.e1603322; Suchul Kang & Elfatih Eltahir (2018), “North China Plain Threatened by Deadly Heatwaves Due to Climate Change and Irrigation”, Nature Communications 9.2894; and Vimal Mishra, Sourav Mukherjee, Rohini Kumar, and Dáithí Stone (2019), “Heat Wave Exposure in India in Current, 1.5°C, and 2.0°C Worlds”, Environmental Research Letters 12.124012.
- G. Naumann et al. (2018). “Global Changes in Drought Conditions under Different Levels of Warming”, Geophysical Research Letters 45: 3285-96.
- Hugo Carrão, Gustavo Naumann, and Paulo Barbosa (2018). “Global Projections od Frought Hazard in a Warming Climate: A Prime for Disaster Risk Management”, Climate Dynamics 50: 2137-2155.
- Jürgen Vogt et al. (2018). Drought Risk Assessment and Management – A Conceptual Framework (Luxemburg: Publications Office of the European Union).
- Naumann et al. (2018). “Global Changes in Drought Conditions under Different Levels of Warming”.
- See the chapter “Freshwater Drain” in Wallace-Wells (2019), The Uninhabitable Earth, for an overview of the problem.
- How “natural” they really are is disputable, of course.
- There are exceptions, of course. Floods in Pakistan and Bangladesh tend to affect much larger areas and populations, for example. And their other (social) effects may also be more similar to “type 2” disasters. See below.
- Benjamin Jones, Eleonora Mattiacci, & Bear Braumoeller (2017). “Food Scarcity and State Vulnerability: Unpacking the Link between Climate Variability and Violent Unrest”, Journal of Peace Research 54.3: 335-50.
- See, for example: Marco Lagi, Karla Bertrand, & Yaneer Bar-Yam (2015), “Food Security and Political Instability: From Ethanol and Speculation to Riots and Revolutions”, in P.V. Fellman et al., Conflict and Complexity: Understanding Complex Systems (New York: Springer): 249-56; and Clionadh Raleigh, Hyun Jin Choi, & Dominic Kniveton (2015). “The Devil is in the Details: An Investigation of the Relationships between Conflict, Food Price and Climate across Africa”, Global Environmental Change 32: 187-99. For a useful overview of the literature on the relation between food security and violent unrest (and a model based thereupon), see: Davide Natalini, Giangiacomo Bravo, & Aled Wynne Jones (2017), “Global Food Security and Food Riots – An Agent-based Modelling Approach”, Food Security, Online First.
- Dan Braha (2012). “Global Civil Unrest: Contagion, Self-organization, and Prediction”, PLOS One 7.10: e48596.
- Lagi et al. (2015), “Food Security and Political Instability”.
- Gary Evans (2019). “Projected Behavioral Impacts of Global Climate Change”, Annual Review of Psychology 70:6.1-6.26.
- Solomon Hsiang, Marshall Burke, & Edward Miguel (2013). “Quantifying the Influence of Climate on Human Conflict”, Science 341 (13 September 2013).
- (1+14%)4–1=68.9%.
- For an overview of the refugee problem in relation with climate change, see, for example: Environmental Justice Foundation (2017), Beyond Borders: Our Changing Climate – Its Role in Conflict and Displacement (London: ESF); and International Organization for Migration (2009), Migration, Environment and Climate Change: Assessing the Evidence (Geneva: IOM).
- See, for example: Norman Myers (2002), “Environmental Refugees: A Growing Phenomenon of the 21st Century”, Philosophical Transactions of the Royal Society of London B 357: 609-13.
- Wolfgang Streeck (2016). How Will Capitalism End?: Essays on a Failing System (London: Verso), p. 65
- Idem.
- See: Rent, Debt, and Power, as well as: Michael Hudson (2015), Killing the Host: How Financial Parasites and Debt Bondage Destroy the Global Economy (Petrolia: Counterpunch Books).
- Steve Keen (2017). Can We Avoid Another Financial Crisis? (Cambridge: Polity).
- Keen (2017), Can We Avoid Another Financial Crisis?
- Hudson (2015), Killing the Host.
- Very many high ranking officials in Western states have close ties with major firms in the FIRE sector. Goldman Sachs has managed to position former employees in very many key positions, for example.
- Safa Motesharrei, Jorge Rivas, & Eugenia Kalnay (2014). “Human and Nature Dynamics (HANDY): Modeling Inequality and Use of Resources in the Collapse or Sustainability of Societies”, Ecological Economics 101: 90-102.
- Idem, p. 91.
- Arguably, the United States are gradually approaching this situation.
- Idem, p. 99.
- Idem, pp. 99-100.
- Walter Scheidel (2017). The Great Leveler: Violence and the History of Inequality from the Stone Age to the Twenty-First Century Princeton: Princeton University Press).
- Giorgos Kallis et al. (2018). “Research on Degrowth”, Annual Review of Environment and Resources 43, p. 4.10.
- James Hansen, Makiko Sato, & Pushker Karechka (2012), “Climate Sensitivity, Sea Level and Atmospheric Carbon Dioxide”, Philosophical Transactions of the Royal Society A 371, 0294
- This paragraph is primarily based on: Charles Hall & Kent Klitgaard (2018). Energy and the Wealth of Nations: An Introduction to Biophysical Economics, Second Edition (Springer).
- On this topic, see also: Crisis and Inertia (4) – Economic, Political, and Cultural Crises.
- Jay Forrester (1971), “Counterintuitive Behavior of Social Systems”, Technological Forecasting and Social Change 3: 1-22. Jay Forrester (1971), World Dynamics (Cambridge: Wright-Allen).
- The most recent edition is: Donella Meadows, Jorgen Randers, and Dennis Meadows (2004), Limits to Growth: The 30-Year Update (London: Earthscan).
- See, for example, chapter 12 in Hall & Klitgaard (2018). Energy and the Wealth of Nations.
- Jan Nitzbon, Jobst Heitzig, & Ulrich Parlitz (2017). “Sustainability, Collapse and Oscillations in a Simple World-Earth Model”, Environmental Research Letters 12: 074020.
- It effectively ignores economic crises and underestimates the effects of the expected economic decline due to the falling EROI of fossil fuels.
- And the starting frequency of natural disasters is based on an estimate of the actual frequency of natural disasters in the real world.
- But the extent of the economic damage also depends on the size of the economy. In a poor country, a disaster causes less economic damage because there is less expensive infrastructure to damage. As a consequence, a poor country also has to spend less to repair that damage. The model takes this into account.
- This might seem low, but it is easy to overestimate war deaths and underestimate deaths related to unrest and stress in more peaceful circumstances.
- Braha (2012), “Global Civil Unrest”.
- Peter Heudtlass, Niko Speybroeck & Debarati Guha-Sapir (2016). “Mortality in Refugees, Internally Displaced Persons and Resident Populations in Complex Humanitarian Emergencies (1998–2012) – Insights From Operational Data”, Conflict and Health 10:15.
- This includes changes to the starting maps. If all countries start rich, without unrest, and with low disaster probabilities, this only increases the time until collapse, but doesn’t change any of the findings.
- And it appears that there is no other way to prevent collapse within the model.
- Notice that this is a prediction of the model and not an assumption. See the last two paragraphs before this one for a very brief description of the demographic module of the model.
- Approximately 650,000,000 in 1700.
- Fossil fuels are – in terms of value – by far the most important commodities in international trade.
- Black/gray lines: average unrest level (right Y-axis). Orange lines: percentage of regions in a state of civil war/social collapse (left Y-axis).
- But not for human existence. We’ll continue survive for a while in the very uncivilized circumstances we’re creating.
- But not of global shocks, of course. A massive comet impact or full-scale nuclear war would obviously lead to very different outcomes.
- Many studies suggest that large refugee flows will be one of the main social effects of climate change. See above.
- Which doesn’t necessarily imply that any other type of economic system would be more able to handle economic decline. However, other economic systems are irrelevant here, as almost all countries have capitalist economies, even most of those that formally adhere to different economic ideologies.
- Thomas Hobbes (1651). Leviathan, XIII.9.
- Jem Bendell (2018). Deep Adaptation: A Map for Navigating Climate Tragedy, IFLAS Occasional Paper 2.
- Or they just discuss doing these things online.
- Mark Lynas (2007). Six Degrees: Our Future on a Hotter Planet, (Harper Collins), chapter 5.