preface (2022)
There are major mistakes in the predictions and calculations involved in this article. For an attempt to come up with better predictions (and thus, an update of this article), see the SotA-R series. The model results presented in the last episode thereof, suggest 3°C to 5°C of average global warming.
(Original post) — Climate scientists don’t often look at the distant future and when they do, their “predictions” are so vague that they hardly count as predictions at all. Most published work on climate change focuses on the current century.1 There are good reasons, for this, of course – even our short term predictions are continuously being updated by new science, and because of the uncertainties involved, long-term predictions are often outside the scope of “serious” science. Personally I’m as much interested in the long term as in shorter terms, however – I can’t help wondering where Earth and humanity are heading. And even if scientists do not give clear answers to this kind of question, they provide many of the pieces of the puzzle.
The following is an attempt to piece together a picture of Earth in the anthropocene. The aforementioned “long term” here refers to time spans within that proposed geological period; not to much longer time spans. (Hence, the final destruction of Earth when the Sun becomes a supernova is utterly irrelevant here.) The anthropocene began when humans started to have significant impacts on climate and geology – impacts that will be measurable and observable in the distant future. There is some disagreement about the exact starting date of the anthropocene. It may be the industrial revolution or the first nuclear tests, or even the beginning of agriculture. The latter seems too early, however, and is unlikely to show up as a clear geological break, and the former two are so close together (on geological time scales) that the difference matters little. Hence, I’ll assume here that the anthropocene started some time between the middle of the 18th and 20th centuries.
As far as I know, the end of the anthropocene has not be defined, but if the beginning of the period is defined as the time when humans started to have significant impacts on climate and geology, then the endpoint should be similarly defined as the time when human influence on the Earth’s climate and geology has become negligible. If anthropogenic CO₂ in the atmosphere is our only lasting influence on climate and geology, then the anthropocene ends when there is no more anthropogenic CO₂ in the atmosphere. Depending on how much CO₂ will be released in the near future, this will be somewhere between several 10,000s of years and 100,000 years (or even double that) from now.
Within that long period (although it is fairly short from a geological point of view) three phases or stages can be distinguished. Stage 1 is the period from the start of the anthropocene until human influence on climate and geology is no longer increasing. In other words, stage 1 ends when humans no longer release CO₂ into the atmosphere and don’t add other pollutants or (major) disruptions to the Earth system anymore either. At the boundary between stages 1 and 2, “natural” processes take over, although many of those “natural” processes will have been set in motion by humans and depend on artificial circumstances.
Stage 2 is the period in which various slow processes that have been triggered in or because of stage 1 run their course. Heating due to CO₂ released in stage 1 will only very slowly melt ice caps, glaciers, and permafrost, for example. Some of these slow processes further affect the global climate – melting permafrost is the most obvious example – so it is not the case that stage 2 is just a passive response of the Earth system to whatever happens in stage 1.
Stage 3 begins when climate change processes that have been set in motion in stages 1 and 2 become so slow that species and ecosystems can adapt to them. Stage 3, then, has a more or less stable climate, but it will be a (very) different climate than what we are used to. Stage 3 is in the distant future. Many of the key slow processes in stage 2 take centuries or even millennia to unfold. How long exactly stage 2 will take and what stage 3 will be like is dependent on whatever happens in stage 1 (but also on cosmic events, of course, but I’ll ignore those).
My main (but not my only) aim here is to try and sketch Earth in the beginning of stage 3 – that is, when the rate of climate change has dropped below the speed of adaptation. But obviously, I can only do that by discussing stages 1 and 2 first. It is important to realize that this sketch ignores many uncertainties. There really is too much that we don’t know to reliably predict the future. Given all that we know – and given the tiny part thereof that I’m acquainted with – this is my best guess of how the anthropocene is going to unfold. Moreover, climate change is developing very fast, so important parts of this sketch may have to be revised. (But I strongly doubt that that will significantly affect the most important conclusions.)
Stage 1
On the long run, there is really only one aspect of stage 1 that matters: how much CO₂ we will release into the atmosphere. Climate scientists cannot tell us the answer to that question, however – they can only tell us what the effects of some amount of CO₂ will be. Rather, this is a question for the social sciences and humanities – for political scientists, economists, historians, psychologists, and so forth. It took some time until this was fully recognized. The Representative Concentration Pathways (RCPs) that have been the basis of the 2013 IPCC report and most subsequent climate modelling are scenarios of future CO₂ releases based on very simplistic assumptions about future conditions. The Shared Socioeconomic Pathways (SSPs) that have been developed from 2014 onward are intended to remedy this.2 The five SSPs are scenarios of future land use, international politics, economics, and CO₂ emissions. They are the best – that is, most scientifically advanced – guesses of what the near future could be like that are currently available (in print). So let’s start with briefly sketching the five SSP scenarios.3
Shared Socioeconomic Pathways (SSPs)
SSP1 is nicknamed “Sustainability” or “Taking the Green Road”. The scenario is characterized by a gradual, but pervasive shift toward sustainability and protection of the environment, and from an emphasis on economic growth toward an emphasis on human well-being. International cooperation improves, global inequality as well as inequality within countries is reduced, and investment in education and health care increases.
SSP2 is the “Middle of the Road” scenario that deviates little from the historical pattern of the past decades. Economic development continues to proceed unequally – some countries continue to get richer, while others fall (further) behind. Countries try to work together to achieve sustainable development and private organizations work towards the same goal, but progress is slow. The environment continues to degrade, even if there are some improvements and humanity’s ecological footprint – or its growth, at least – becomes a little bit smaller.
SSP3 is nicknamed “Regional Rivalry” or “A Rocky Road” and is characterized by nationalism, conflict, and growing concerns about security and competitiveness. Because of this, countries increasingly focus on domestic and sometimes regional issues. National and regional security, including food and energy security, become the primary concern of governments, and international cooperation gradually breaks down. Investment in education and technology decrease, economic growth slows down, and inequality – both within countries and between them – increases.
SSP4 is even more unequal than SSP3 and is, therefore, nicknamed “Inequality” or “A Road Divided”. In this scenario there are vast differences in investments in human capital and in economic opportunities and political power both within and across countries, and consequently, inequality and socio-economic stratification further increase. The gap between the rich and the poor, between the more connected and the less connected, between the higher educated and the lower educated, between capital intensitivity and labor intensitivity, between the clean and the dirty, and so forth, becomes wider and wider. Social cohesion deteriorates, leading to conflict and unrest. Environmental policy ignores the socio-economic losers.
SSP5 is a neoliberal techno-utopia and is nicknamed “Fossil-fueled Development” or “Taking the Highway”. In this scenario faith in competitive, “free” markets increases. The world becomes one huge free trade zone. Investments in education, innovation, health care, and human capital push economic growth, which is driven by burning fossil fuels. Climate change and environmental problems are managed by means of technology, including increasing energy-efficiency and geo-engineering.
Before assessing the plausibility of these scenarios, let’s have a look at how the predictions for the various scenario’s are made. All scenarios involve (and/or have been used in) predictions of future land use, energy use, economic growth, population growth, urbanization, hunger, conflict, pollution, CO₂ emissions, and more. Analyzing all of those is obviously beyond the scope of this article, however, so I’ll focus on a few aspects that struck me as particularly important for assessing the overall reliability of the SSP approach to forecasting the future.
Economic foundations
Economic prognoses are part of the foundations of the SSP scenarios. Many of the narrative details that specify the general direction and character of the various scenarios depend on economic circumstances. Increasing investment in education or health care (as in SSP1 and SSP5), for example, is not possible if there is insufficient economic growth. Three different models were used to create economic predictions for the five scenarios,4 and of those three the model by Rob Dellink and colleagues was chosen as “the representative ‘marker’ SSP projections”.5 The nature of their approach and model (which is based on a model developed by the economics department of the OECD) is revealed by the following remark:
There is no unified theoretical model of economic growth . . . , and many ways of representing economic growth, and especially technological progress, exist. Macroeconometric models have been popular, but lack a theoretical foundation. They are subject to the Lucas Critique . . . , which states that models that are purely based on historical patterns cannot be used for policy advice, as they lack an explanation of the underlying structural parameters (. . .).6
Let’s translate the key points into ordinary language. “Macroeconometric” models are models based on statistical patterns found in real data of economic growth. If it has been shown that economic growth in various countries and time periods correlates with the introduction of new technologies, then a macroeconometric model includes new technology as one of the variables that explain and predict economic growth. In other words, macroeconomic models are based on observed (and measured) historical reality. The “Lucas Critique” is named after Robert Lucas, an influential neoclassical economist, and holds that such macroeconomic models are invalid because they lack a “theoretical foundation”. For mainstream, neoclassical economists such a “theoretical foundation” can only be microeconomics. The required microeconomical foundation of macroeconomic models (of economic growth and so forth) disassemble the economy into a collection of perfectly rational, perfectly informed, and perfectly selfish actors that all have identical preferences. Then, on the basis of those – obviously absurd – assumptions it builds a model that is incoherent, empirically false, and practically useless.7 Perhaps, the utter lack of realism and lack of predictive value of models based on these foundations is best illustrated by the fact that they imply that economic crises are impossible. According to mainstream economists, the 2008 “Great Recession” would not and could not happen.8 The “Lucas Critique” tries to change this lack of realism into a virtue, however. A model that confirms to historical, empirical reality is suspicious from the Lucasian point of view, and an unrealistic model that follows from the uncritically accepted, but nonsensical assumptions of neoclassical (micro-) economics is “theoretically sound” (or something similar).
In short, then, what the above quote means is that the model by Dellink and associates is explicitly and self-consciously unrealistic, unhistorical, unempirical, and entirely based on nonsensical assumptions and fallacious reasoning.9 This kind of model has actually been so unsuccessful in predicting economic development that we can infer one thing from the model: namely that the economic future will be very different from what this model predicts. The other two models aren’t any better,10 unfortunately, and consequently, the economic foundations of the SSPs are built on quicksand. This is a serious problem for a number of reasons. As mentioned above, a society cannot invest in education or health care if it lacks the funds, but there are more fundamental problems. There is a link between economic stagnation and CO₂ emissions, for example – in stagnating or contracting economies, CO₂ emissions do not grow as fast or even decline. This is in this context obviously very relevant. But there are other effects as well. Economic crisis and stagnation lead to unemployment, poverty, and insecurity and all of those feed political extremism (especially on the right of the political spectrum) and social unrest. Hence, different economic futures may lead to very different political and climatological futures.
A key factor that is ignored by neoclassical models such as those used for the SSPs is debt. According to mainstream economists, debt is economically irrelevant. Because of that, the financial sector does not exist in their models. This is problematic for at least two reasons. Firstly, as several non-mainstream economists have shown, excessive debt leads to crisis and stagnation.11 If the sum of private debt in an economy is close to or exceeds 150% of GDP crisis is unavoidable (although it can be postponed). “Ideally”, a crisis then returns debts to economically acceptable levels through a wave of bankruptcies or other kind of debt cancellations, but in the Great Recession this was avoided by bailing out the banks instead, and consequently, very many countries are now stuck with debilitating private and/or national debts and a powerful financial sector that controls economic policy and that does not allow any kind of debt cancellation.12 The result is economic stagnation without any real chance of recovery. Given that situation, it is not at all unlikely that capitalism will give way to something else, but considering the signs – rising authoritarianism and nationalism around the globe, for example – it is likely to be something far less “free”.13 In addition to being hopelessly unrealistic (etc. – see above), the model used for the SSPs also assumes “business as usual” – that is, that there will be no systemic change – but that assumption is almost certainly false: we’re heading for turbulent times.
Secondly, hiding the financial sector (or assuming that it doesn’t exist) also obscures the different ways in which different sectors “contribute” to the economy, and such differences matter. Erik Reinert has shown, for example, how economic development depends on dense networks of urbanized manufacturing.14 Without those, an economy can only feed a much smaller population. Importantly, the financial sector doesn’t really contribute to the real economy at all – having a large financial sector doesn’t mean that a country can feed more people (but that should be kind of obvious – you can’t eat money). Aggregating different economic sectors, therefore, obscures the most relevant aspect of an economy on the long run.15 Without knowing the size and health of the manufacturing sector, it is impossible to predict economic development. But thanks to mainstream economic dogma, such data is unavailable (or insufficiently available, at least).16
Other SSP predictions
The most appropriate qualification of the economic foundation of the SSPs is “nonsensical”, but perhaps the models do better in other respects. Conflict plays an important role in all scenario’s. In some (1 and 5) there is expected to be little conflict, in others (3 and 4) there is a lot. This includes both international, diplomatic and military conflict as civil conflict. Håvard Hegre and colleagues tried to predict civil conflict.17 Their model predicts conflict on the basis of the following variables: wealth (GDP/capita), “population size, conflict history, time since independence, and conflict involvement among neighboring countries”.18 Drought, hunger, and other direct climate effects are not included in the model, which appears to be motivated by a lack of clear correlations between these and conflict in the literature they reviewed. Neither do they take migration and refugees into account. So, if parts of India dry out leading to millions of immigrants in another part of India (where the situation is only slightly less precarious) this will not lead to civil conflict according to the model. If the Middle East and Central America dry out even further leading to increased refugee flows to Europe and North America – refugee flows well beyond what can be contained – then this does not lead to conflict according to the model. I’m not sure how to express my appreciation of these conflict predictions – let’s call them stupefyingly absurd.
So now we appear to have a serious problem – the best predictions we have of possible trajectories for the near future are nowhere near good enough. But perhaps that doesn’t really matter. In the long run, only CO₂ emissions matter.19 If, at least, we can get a useful prediction of cumulative CO₂ emissions, then, for present purposes, that is all we need. It may seem that these broken scenario’s cannot possibly deliver, but we may not need that much precision. A graph in the overview of the SSP scenarios by Keywan Riahi and colleagues compares the SSPs to the RCPs that have been used in climate modeling since the 2013 ICCP report.20 This graph shows that:
- the greenest scenario, SSP1, leads to CO₂ emissions above RCP4.5 and possibly close to RCP6.0;
- SSP2 is about midway between RCP6.0 and RCP8.5;
- SSP3 is around RCP8.5 with a considerable margin of uncertainty;
- SSP4 is just below RCP6.0; and
- SSP5 is above RCP8.5.
This is very helpful information because a lot of research has been done on the climate effects of the RCP scenarios. For RCP4.5 the “official” expectation of the IPCC in 2013 was that temperature increase by the end of the current century relative to the pre-industrial (1850-1900) average would be in the range of 1.7 to 3.3°C, for RCP6.0 between 2.0 and 3.7°C, and for RCP8.5 between 3.2 and 5.4°C. Several models show higher temperatures, however, and in the past five years all of these estimated temperatures have increased. The lower bound of RCP6.0 is now more commonly believed to be around 2.6°C, for example, and that of RCP8.5 around 4°C. Temperatures will keep rising, for a while, however, because the climate only responds slowly to an increase in CO₂. Fortunately, chapter 12 of the 2013 IPCC report includes estimates for the end of the 23rd century (and even the 30th century, but the report predicts that after the 23 century the climate stabilizes). For RCP4.5 the increase is then between 2.1 and 4.1°C, for RCP6.0 between 2.5 and 5°C, and for RCP8.5 between 3.6 and 13.2°C.21 Feedback effects are not really taken into account here (or not sufficiently, at least), however, as not enough was known about them (with sufficient certainty) when this report was published.
What this means is that even in the most optimistic scenario – that is, SSP1 – CO₂ emissions by themselves (i.e.not taking feedback effects into account) will increase Earth’s average temperature on the middle-long term (i.e. by 2300) by approximately 3°C. Even scientists who are relatively optimistic about CO₂ emissions in the SSP scenarios conclude that meeting the 2°C goal of the Paris agreement is impossible.22 3°C may not seem like much, but remember that this is an increase before feedback effects, and most climate scientists believe that this temperature is above the tipping point of some major feedback effects such as Amazon and boreal (taiga) forest dieback, and permafrost melting. These feedbacks add CO₂ and thus add to global warming. Hence, crossing these tipping points means that average temperature increase will be much more than 3°C. How much more matters, of course, but much depends on the nearer future (i.e. stage 1).
Details and guesses
Stage 1 of the anthropocene ends when humanity stops emitting CO₂ or sequesters as much as it emits. This can be achieved in two ways: through technological, political, and socio-economic change; or through catastrophe. Technologically and economically it is probably possible to transfer to renewable energy sources (possibly supplemented with nuclear energy), to overhaul agriculture and food production, and perhaps to use carbon sequestering to cancel the remaining CO₂ emissions. We could probably achieve this within three or four decades. This is more or less the SSP1 scenario, and it requires far-reaching international cooperation, almost universal commitment to sustainable development, and an almost complete change of our socioeconomic systems. It requires the substitution of something much more Utopian for the neoliberal capitalism that we have gotten used to, and it requires this substitution soon and with near universal consent and support.
We’re not on that path. The world is not converging toward international cooperation, sustainability, and an Utopian overhaul of capitalism. Rather, in almost all countries nationalism, authoritarianism, totalitarianism, and even fascism are on the rise.23 International cooperation is breaking down. If there is something trickling down from the wealthy, it is the rich pissing on the poor. Sustainability and other environmental issues are rarely a priority on the international level. And country after country is turning inwards. In other words, we are on the pathway of SSP3: the “Rocky Road”. What this scenario predicts is very similar to the predictions of, for example, Christian Parenti or Joel Wainwright and Geoff Mann: a world of inward-looking, totalitarian, rich fortresses surrounded by an increasingly turbulent sea of poverty, disaster, hunger, chaos, and war. Parenti calls this the “armed lifeboat”; Wainwright and Mann speak of “climate leviathan”.24 That we are following SSP3 now doesn’t mean that we’ll continue on that path, however, not in the least because that is impossible because SSP3 – as explained – involves very implausible predictions about economic growth and conflict beyond the very near future.
Most likely is that we’ll continue following something very much like SSP3 for one or two decades during which there is a gradual increase of many of that scenario’s most negative aspects, but which will also be characterized by increasing economic stagnation. The cause of this stagnation is that the world economy is being choked by debt and rent extraction.25 This stagnation will bring a further increase in economic inequality (as predicted by SSP3), but will also exacerbate the isolationist, nationalist, and authoritarian tendencies that feature prominent in that scenario (and in current political reality, of course). In addition to this, global warming will continue and even slowly increase, leading to more and bigger disasters. Camilo Mora and colleagues predict that by the end of the current century most of the world population will be continuously exposed to one or more (up to six) climate-related disasters,26 but this disastrous situation will not start suddenly in 80 years from now – rather, we’re slowly sliding towards it. Increasingly, some parts of the planet will become inhospitable to human life, either because they become too hot (more about this below), or because they are destroyed by disasters too often to make rebuilding and/or adaptation feasible. This will start slowly and spread faster and wider depending on CO₂ emissions (as well as other factors, but CO₂ emissions mainly). The consequence is that the numbers of refugees and migrants will continue to grow. Very soon their numbers will be larger than what walls can stop and concentration camps can contain.
These interacting pressures – economic stagnation, variants of authoritarian nationalism (or regionalism), disasters, and increasing numbers of refugees – will make collapse virtually unavoidable. There will be wars, civil wars, terrorism, revolutions, and various other kinds of bloodshed. Where and how this will begin is impossible to predict; partially because there are too many candidates. Water will probably be the resource that provokes the most conflict. A war between India and Pakistan over water is a distinct possibility and was already predicted by Gwynne Dyer in 2008, albeit on the basis of flawed assumptions about the effects of climate change.27 India and Pakistan have nuclear weapons, and so does Israel, for example, which is also located in an area were conflict over water will heat up in the coming decades. These are hardly the only countries with nuclear weapons, moreover, and neither are they the only likely locations for the eruption of war. Again, where and when exactly the aforementioned interacting pressures will first lead to war is impossible to predict, but that they will is almost certain, and that nuclear powers will refrain from using nuclear weapons is highly unlikely. (Especially considering that there is no effort of nuclear disarmament anymore and increasingly nationalistic countries are also becoming increasingly militaristic.)
So, it is quite likely that at some point in the 21st century, probably already in the first half, there will be some employment of nuclear weapons. I don’t believe that there is a high probability that this will lead to full-blown nuclear war, however, because few in the military are or will be unaware of where that would lead to.28 Most likely it will be limited to small-scale nuclear conflicts and/or the use of so-called tactical nuclear weapons, which have a very small yield. Still, this could be very relevant in the present context for a number of reasons. Firstly, nuclear war would kill even more people and destroy even more infrastructure than conventional war, and – although it feels horrible to write this – from a long-term point of view that is actually a good thing. Less people, less factories, and less cars means less CO₂ and thus less global warming. Secondly, nuclear war could lead to nuclear winter. The seriousness of nuclear winter depends very much on how many and what kind of nuclear weapons would be used.
Full-scale nuclear war involving 250 or so average size strategic nuclear weapons would produce more than 75 Tg of soot, which would lead to a decrease of global temperatures to a level similar to that in the last ice age, and a worldwide decrease of precipitation of more than 25%. The tropics would be hardest hit by drought, while the temperate zones would freeze over. Food production would collapse almost everywhere on Earth. The worst effects would only last a few years, but that is enough to kill almost all of mankind. Again, given that these consequences should be fairly well-known, I doubt that any sane military strategist would seriously consider risking this. A much more minor nuclear conflict, involving only 15 to 20 average average size, strategic nuclear weapons would only produce approximately 5 Tg of soot, but even that would have big effects. It would reduce rainfall (up to 80%!) and shorten growing seasons on most of the planet for anywhere between 5 and 25 years, and the resulting famines and other indirect effects are estimated to kill between one and several billions of people.29 Perhaps, the use of nuclear weapons will be limited to a few strikes with low-yield tactical weapons, however. In that case the effects on climate will be negligible. Whether that is a good thing or a bad thing depends on how you look at it.
Increasing droughts, deadly heatwaves, recurring disasters, and all the other problems associated with climate growth will almost certainly lead to attempts at geo-engineering. These will be unilateral attempts, as SSP3 predicts a breakdown of international cooperation (especially on the global level and especially with regards to environmental issues) and we’re already witnessing the beginnings thereof. The only kind of geo-engineering that is feasible (technologically and economically) for single states (or small groups of adjacent states) is solar radiation management (SRM) by means of stratospherical sulfur or sulfate injection. This is cheap and easy and would cool down the planet by reducing the amount of sunlight that reaches Earth’s surface. It would also have some nasty side effects, however. It might lead to ozone depletion (increasing skin cancer). It might increase acid rain (damaging forests and buildings). It might bleach the sky (resulting in a whiter sky). It might have all kinds of unexpected effects on atmospheric air circulations. All of these are uncertain. What is certain, on the other hand, is that if these injections would suddenly stop then Earth would suddenly warm up very quickly – much faster than ecosystems can handle. And what is even more troubling is that reducing the amount of sunlight that reaches the surface doesn’t just cool the planet, but also reduces the amount of energy available for plants. This reduction in sunlight would lead to a loss in agricultural food production that is approximately equal to the gains resulting from cooling.30 Hence, while such geo-engineering would cool down the planet, it would not improve the global food situation and might even deteriorate it. Furthermore, the effects would be unequal – some regions would cool down more, others less, and some regions would lose more food productions, and others less. And it is very unlikely that the losers of geo-engineering – that is, countries that see a decline in food production and an increase in hunger due to SRM – just sit by and watch the airplanes spreading cooling chemicals in the sky. In all likelihood, geo-engineering will lead to war.
So what I expect is something like the following. When things get too bad some rich countries will try to turn the tide by means of SRM.31 This will lead to a sudden cooling giving many ecosystems a kick. Many will already be too far gone to recover and this kick will send them over the edge. In some areas things will improve, but in many SRM will only lead to a further deterioration. This will not be immediately clear, so it will probably take two (disastrous) growing seasons before resistance materializes sufficiently. Then, either war or terrorism will halt the SRM program. As a consequence, the Earth will rapidly heat up again (to pre-SRM levels plus a bit due to further CO₂ increase), which will send even more ecosystems over the edge. The end result will be more disaster, more violence, and more distrust between countries.
As mentioned before, global warming is speeding up. There is a time lag, so even if we stop emitting CO₂ now, the Earth will continue heating up for a while. We’re not stopping for a while, so heating is only speeding up. This will make more and more parts of the planets inhospitable or even uninhabitable. This will start slowly, but it will gradually speed up, and consequently, the numbers of refugees and migrant will also increase and continue to increase (until a natural limit is reached, of course). Countries that haven’s succumbed to civil war, war, or “natural” disaster will eventually collapse when the number of refugees becomes too much to handle – when food and water run out and when there aren’t enough bullets to stop the hungry from begging. Slowly, the planet will collapse into chaos (or very quickly in case of nuclear war). Some countries will collapse due to revolts, other due to war, others due to disasters or immigration beyond what it can handle, but the consequence of the path we are taking is that eventually everything collapses.
Such a collapse would end stage 1 of the anthropocene. It would sooner or later return most of the planet to Medieval or even Neolithic circumstances. It would reduce human CO₂ emissions to a negligible level. Perhaps, somewhere on our way to that we’ll be able to change course, however, but that might be too late. Everything – again – depends on CO₂.
So let’s try to estimate total CO₂ emissions to try to get a clearer picture of the future. SSP3 starts with emission levels that are nearly identical to those of RCP8.5. However, RCP8.5 assumes that emissions will continue to rise until the end of the 22nd century (at least), which is highly unlikely. Things will start to break long before that. Due to economic stagnation, CO₂ emissions will fall behind RCP8.5 within a few decades. After that, they will start decreasing more rapidly due to disasters, (civil) wars, and societal collapse. This collapse will start regionally (in the politically and economically weakest regions, which also are the regions that are most vulnerable to climate change and disaster), but will gradually spread until they engulf the planet. The decline may be more rapid than that projected for RCP6.0, but because of the head start – that is, the RCP8.5-like emissions in the coming decades – the total CO₂ emissions in stage 1 of the anthropocene will be significantly higher than those projected in RCP6.0. They won’t be nowhere near as high as RCP8.5, however. If we put this in a diagram, we get something like this:
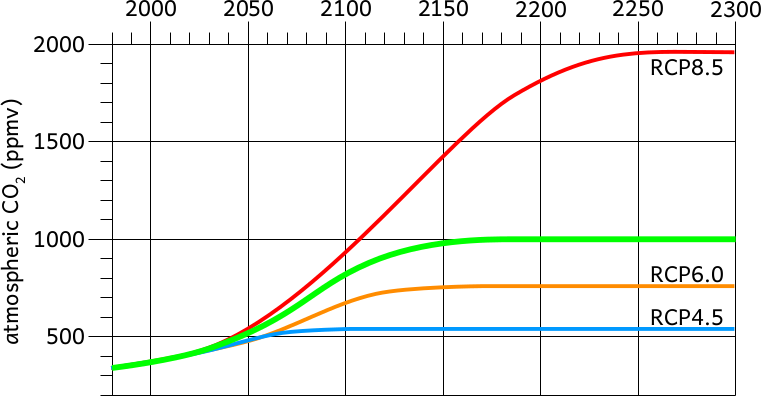 The thick green line is the scenario sketched here. Note that on this time scale it doesn’t matter much when and where (civil) wars break out (and so forth). What does matter is that we start very close to RCP8.5 (as is the case in SSP3), but start falling behind that scenario soon, followed by a further decline in CO₂ emissions. It makes a big difference, how fast that decline is, however. If it is very fast (due to widespread and extremely destructive war, for example) then we’ll end up with something like 900 ppmv CO₂, or even a bit lower than that (if we’re very lucky, or get smart); if it is very slow (because war and disasters turn out to be far less severe), we’ll be closer to 1100 or even higher. In case of all-out nuclear war in the first half of the 21st century, it may even remain as low as 600 or 700 ppmv.
Stage 2
Stage 1 ends when net human greenhouse gas emissions return to close to zero, or in other words, when the line in the diagram above becomes flat. Depending on how fast global society self-destructs this will probably be somewhere between 2050 and 2150. And depending on how soon stage 1 ends it will result in an atmospheric CO₂ level before (major) feedback effects of somewhere between 800 and 1200 ppmv (or lower in case of large scale nuclear war early in the 21st century). After this, “natural” processes take over. (Well, … they are natural, but their setting in motion will be entirely due to us.)
Tipping points and feedbacks
The estimated human CO₂ emissions in stage 1 are sufficient (by themselves) for somewhere between 3 and 8°C (or even more) average global warming by 2300, but probably closer to 4 or 5°C than to the higher number. In any case, this is almost certainly more than enough to trigger a number of so-called tipping points resulting in various positive and negative feedback effects.32 Some of these work through a further increase in CO₂; others work differently. “Positive” means resulting in further temperature increases, by the way, and unfortunately the positive feedback effects far outweigh the negative ones.
Two examples of tipping points or feedbacks that do not (directly) add more CO₂ are albedo change and weakening of the Atlantic meridional overturning circulation (AMOC). Albedo is the extent to which Earth as a whole or parts thereof reflect sunlight. Snowcover has a high albedo and thus reflects much sunlight, while forest, for example, has a low albedo. Due to loss of snow in temperate and cool zones, Earth’s albedo decreases. Desertification, on the other hand, increases the albedo in other parts. The overall sum of these effects is expected to be negative, however, meaning that warming leads to an overall decrease of Earth’s albedo, leading to less reflection, and thus more warming. Like most climate effects, there are considerable regional differences in the effects of changes in albedo, however.
The Atlantic meridional overturning circulation (AMOC) drives the Gulf stream, which keeps much of Northern Europe relatively warm. The influx of freshwater from melting icecaps and glaciers in the arctic is weakening AMOC, however, and this weakening is expected to continue until at some point a tipping point is reached and the Gulf stream stops. Over the last one-and-a-half century AMOC has already weakened by 15 to 20 percent,33 and while it is not known when exactly the tipping point will be reached, it is almost unavoidable that it will reached, possibly already in this century. The effect thereof will be a sudden and drastic cooling of Northern Europe (where “Northern” includes pretty much everything north of France). What this illustrates is that the rich, Western countries won’t be safe in their fortresses for long. Northern Europe will become too cold to produce enough food for its population; and Southern Europe and the United States too dry.
In the long run, the feedbacks that work through further increases of atmospheric CO₂ are far more important, because they affect the whole planet, and because their effects are – at least potentially – much stronger. The most important here are forest dieback and permafrost melting. There are others, however. One of the hardest possible feedbacks to get a grip on (for me at least) is oceanic CO₂ uptake. The 2013 IPCC report suggests that warming will lead to less uptake of CO₂ by the oceans,34 but the size of this effect is unclear, and on the long run, more CO₂ will lead to more uptake by land and oceans. This may be on the very long run, however, and may outweigh the effects of warming on the shorter term. Will Steffen and colleagues recently suggested that the weakening of CO₂ sinks will add 0.25°C to global warming, for example.35
In 2008 Richard Betts and colleagues estimated that if the Amazon would be lost due to global warming this would release 73 Gt carbon in the atmosphere,36 but that may be a low estimate. The carbon stock of tropical forests is more than 1000 Gt,37 and not just the Amazon forest is under threat. If a patch of tropical forest would change into savanna, its carbon stock would reduce to (much) less than half, and if – in the long run – more than half of the tropical forest would disappear due to drought and/or ecological collapse (which seems a rather conservative estimate) this would result in a loss of carbon stock of at least one third of that 1000 Gt. Not all of that would end up in the atmosphere, but most of it would (eventually), which would add somewhere around 150 ppmv CO₂ to the atmosphere in the coming centuries.
Boreal (taiga) forest dieback is a more complicated story because while in some (southerly) areas boreal forests are expected to disappear due to drought, in other (northerly) areas new taiga will come up in what is presently tundra. Unfortunately, both effects are bad. A change from taiga into tundra increases albedo, but also creates a carbon sink. Of these two effects the albedo effect is probably stronger, leading to more warming. The extent of boreal forest dieback is hard to estimate. If half the taiga disappears and what replaces it has half the carbon stock, then this would release less than 50 Gt carbon, which would add a bit over 20 ppmv CO₂. But this number is really just a guess as it is hard to predict how much taiga will be lost and what will replace it. Some forests in temperate zones will also be lost, by the way, mainly due to drought and/or ecosystem collapse (more about the latter below). The amount of CO₂ this adds to the atmosphere may be in the same range as that resulting from boreal forest dieback, but this too is hard to estimate. Perhaps, it is a reasonable estimate that forest loss outside the tropics will add somewhere around 50 ppmv CO₂ to the atmosphere in the next 2 to 5 centuries.
By far the biggest and most important feedback is permafrost melting. The permafrost is one of the world’s largest reservoirs of carbon, but this carbon is stored in the permafrost in two fundamentally different ways. The top meters of the permafrost consist of frozen and partially frozen soil, but this soil consists mostly of dead organic matter (i.e. dead plants) similar to peat in more temperate areas. Secondly, a vast amount of methane is locked in small bubbles in the ice below that. Methane is about 28 times as potent as a greenhouse gas as CO₂, so the release of that methane would have severe effects. T. Schneider von Deimling and colleagues estimate that in the RCP8.5 scenario, the CO₂ released by the decomposing top-three-meter of the permafrost would add between 303 and 467 Gt carbon to the atmosphere in 2300.38 They admit that this is a conservative estimate, however, and also state that by 2200 the near-surface permafrost would be completely thawed. The total amount of stored carbon therein is approximately 1700 Gt, however – more than currently present in the Earth’s atmosphere. Some of this carbon will remain in the soil, but if all that permafrost melts, much of it – up to around 1000 Gt – will eventually be released. Depending on how much carbon remains in the soil, tundra thawing and decomposition will add anywhere between 180 to 470 ppmv CO₂ to the atmosphere. Eventually, we’ll probably end up closer to the latter estimate than to the former.
In addition to this there is about 400 Gt of carbon locked in ice in so-called methane clathrates. There is more methane in clathrates in the continental shelf, but most research thus far suggest that melting sub-oceanic clathrates don’t pose a serious threat (because the methane released will be absorbed by the sea). Melting continental clathrates are more problematic, however, because they will release their greenhouse gases directly to the atmosphere. Not all continental clathrates will melt, however. Even if Earth heats up a lot and the permafrost melts, winters in the far north will remain relatively cold and clathrates deep in the soil will probably remain frozen. Perhaps half of the 400 Gt of carbon in continental clathrates will released, but more likely even less than that. The problem, however, is that what they contain is methane, which as mentioned above, is approximately 28 times more potent as a greenhouse gas than CO₂. Consequently, if only 10% of this carbon is released, its heating effects would be comparable to an atmospheric CO₂ increase of more than 500 ppmv. Much of this atmospheric methane will be broken down to CO₂ and water in the atmosphere fairly quickly, however, so on the long run methane clathrates are less threatening (even if they may contribute to faster heating in the coming centuries).
Let’s add up these various sources of CO₂ to see where we end up:
| atmospheric CO₂ at the end of stage 1 (before (major) feedbacks) |
1000 ppmv (800 ~ 1200) |
| tropical forests | 150 (100 ~ 200) |
| other forests | 50 (25 ~ 75) |
| permafrost soil thawing and decomposition | 350 (200 ~ 500) |
| permafrost clathrate melting | 100 (50 ~ 150) |
| ocean uptake | ? |
| other effects | ? |
| total | 1700 (1000 ~ 2500) |
Obviousy, the uncertainty margins are vast here, but the probability curve is approximately bell-shaped and values close to the extremes are quite improbable. Most likely we’ll end up somewhere in the 1500 ~ 1700 ppmv range (but I might be overly optimistic). This, of course, raises the question what that will do to Earth’s climate.
Global tipping points and ecosystem collapse
The tipping points mentioned thus far are regional tipping points – while they involve sudden shifts on the regional level, they do not tip the Earth system as a whole from one state into another. There also are global tipping points, however. Earth could tip into one of the following states, for example: ice age, icehouse, moderate greenhouse, wet greenhouse, or baked-crust hothouse. There is no consistent terminology with regards to some of these states, which is a source of potential confusion. The authors of the famous “Hothouse Earth” paper, for example, write that
social and technological trends and decisions occurring over the next decade or two could significantly influence the trajectory of the Earth System for tens to hundreds of thousands of years and potentially lead to conditions that resemble planetary states that were last seen several millions of years ago, conditions that would be inhospitable to current human societies and to many other contemporary species.39
This is the state they refer to with the term “hothouse”. More commonly that term is used to refer to “baked crust” conditions like those on Venus, which is obviously an entirely different kind of state. The kind of state Will Steffen and colleagues are warning for in their paper – taking into account that it is a state that did exist on Earth “several millions of years ago” and that is merely “inhospitable” – appears to be what I would call a “moderate greenhouse”. What makes this state fundamentally different from the current state is just that it is too warm for ice ages to occur. This difference may be as small as 4°C rise in average global temperature. It seems, very likely, therefore, that Earth will “tip” into that state, but whether it will remain there very long is far from clear. In 100,000 years or so, CO₂ levels will probably have dropped more than enough to return to the familiar cycle of ice ages and interglacials.
Tipping into an ice age is improbable, but not impossible. One of the potential triggers of an ice age is a severe slowing of the Atlantic meridional overturning circulation (AMOC),40 which (as mentioned above) is already weakening. However, average global temperature is almost certainly rising too much and too fast for an ice age to be possible. And an icehouse state, also known as “Snowball Earth”, in which the whole planet would freeze over, is completely impossible.
Whether Earth could tip in one of the other two states, wet greenhouse (or sometimes “wethouse”) or baked-crust hothouse, has been investigated by several research groups. For the hothouse scenario (i.e. Venus-like conditions) the answer is that this is completely impossible until the sun starts expanding in billions of years from now. A wet greenhouse would be a situation in which the average temperature on Earth is at least 20 °C higher than present and the atmosphere would contain lots of water vapor (which is an extremely potent greenhouse gas). Human life would be impossible on Earth in such conditions, and almost all other mammals and birds (and very many other kinds of animals) would die out as well. Some research groups conclude that it is in principle possible to tip into such a state, but it would require burning an immense amount of fossil fuels and the planet would become uninhabitable long before we’d be finished burning all of that. Hence, it is almost certainly impossible that we’ll tip the planet into a wet greenhouse as well.41
While it’s nearly impossible to tip into a wet greenhouse, which would kill almost all mammalian and avian life as well as much other life on Earth, we are heading for conditions that lead to widespread ecosystem failure. Very many parts of the Earth become too hot or too dry to sustain anything remotely similar to their current ecosystems. One particularly worrying trend is the sharp decrease in insects and other arthropods due to global warming.42 Insects play key roles in many ecosystems and their disappearance – especially in combination with other major changes – could trigger cascades of extinction and ecosystem failure. In almost all cases, what would replace the existing ecosystem is something much poorer both in variety and biomass, and consequently, ecosystem failure would also add more CO₂ to the atmosphere (but to some extent this was already taken into account above).
How hot?
If atmospheric CO₂ rises to somewhere between 1500 and 1700 ppmv then we’re approaching the RCP8.5 scenario. Estimates of long-run temperature increase in that scenario have gradually increased over the past half decade as more and more is learned about various feedback effects. Originally it was estimated at between 3.6 and 13.2°C, but soon the upper limit approached 15°C. Even that may be optimistic, however. One problem with such estimates is that they often result from models that aren’t really suitable for more extreme conditions (because they were developed Earth’s response to relatively modest changes). Models in which the Earth system is pushed to its limits, like those used to estimate the likelihood of a wet greenhouse, for example (see above), may be useful as corrective perspectives. James Hansen and colleagues, for example, suggest that 2240 ppmv, which is only a little bit more than the 2000 ppmv in RCP8.5, would lead to an average global temperature increase of 16°C,43 which would make Earth uninhabitable for humans. And David Kidder and Thomas Worsley model a number of scenarios in addition of those that might lead to a wet greenhouse or hothouse, and some of those scenarios are much more similar to the one suggested above.44 Based on their model, the 1500~1700 ppmv suggested above would lead to an average global temperature increase of 8 to 10°C with a peak of another +2°C between 5 and 7 centuries from now (such peaks occur in many, but not all models, by the way). A 10°C increase for 1500~1700 ppmv doesn’t seem implausible if 2240 would lead to 16°C. Furthermore, the last time CO₂ on Earth approached 2000 ppmv it was about 12°C warmer, but the sun was weaker.45 We’re probably heading for slightly less CO₂ but with a hotter sun, so temperature increase is likely to approach a similar level.
A 10°C increase would melt the Greenland ice cap, but only part of the Antarctic ice cap,46 and would, therefore, lead to a sea level rise between 45 and 60 meters. The first 30 to 40 meters would take a thousand years. After 2000 years sea level rise would be between 40 and 55 meters (compared to present). The last 5 meter takes another millennium.47 This doesn’t mean that all land that is currently lower than 45 to 60 meters above sea level will inundate (as maps of sea level rise typically suggest), however. There are large regions that are lifting up and for some of those (such as parts of Canada and much of Greenland) the speed of this post-glacial rebound is approximately similar to the speed of sea level rise.48
Much more important than sea level rise is the warming itself, however. An average temperature increase of 10°C would make many parts of the planet uninhabitable. “Wetbulb” temperature is a measurement of temperature taking evaporation, and thus humidity, into account. Traditionally this was measured by putting a thermometer in a wet cloth and swinging that above one’s head. At 100% humidity evaporation cannot cool down the thermometer, and thus wetbulb temperature is equal to the air temperature, but at lower humidities the wetbulb temperature is lower than the air temperature. If the wetbulb temperature exceeds 35ºC humans (and many other mammals) are unable to reduce body heat and die within a few hours, but even lower wetbulb temperatures are dangerous. Above 28°C, for example, physical effort is potentially lethal. Steven Sherwood and Matthew Huber modeled and mapped maximum wetbulb temperature on Earth after 10°C average global warming.49 The map below is an updated version of their findings (published online in 2012):
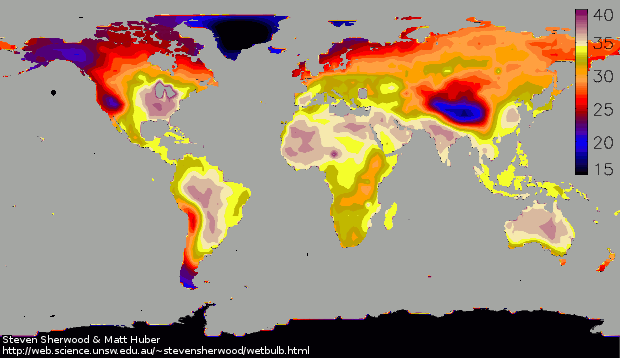 Light colors are lethal on this map. Black, blue, and dark red areas are fine. Yellow, white, and purple are uninhabitable. Orange areas are less clear. As long as the wetbulb high doesn’t last too long and people living in such areas don’t do anything, they can survive, but a once-in-a-decade heatwave that peaks a little bit over these mapped maxima would kill off almost everyone. Hence, nomads who take refuge in higher (mountainous) areas during the worst part of summer could probably survive in the orange areas, but an agricultural civilization would almost certainly be impossible there. (For comparison, the light orange that colors much of Siberia on this map now only occurs in small parts of the Amazon and India.) Not all dark-colored areas are equally hospitable, by the way. The Tibetan plateau and surrounding areas are blue to red, but that is mostly because these areas will be extremely dry, and not because they will be “nice and cool”.
Stage 3
The boundary between stages 2 and 3 was defined above as the approximate moment when the rate of climate change and other physical-geographical change falls below the rate of human and ecological adaptation. This will probably be some time around the 40th century, meaning that stage 2 will last about two millennia. The slowest process mentioned above was sea level rise, but that is not the only change that would take a very long time to stabilize. Thawing and decomposition of near-surface permafrost would only take a few centuries, but the release of methane from melting clathrates below part of the permafrost would be much slower. Ecosystem collapse and resulting CO₂ release would also be a slow and continuous process under the influence of continuing change, so the increase of atmospheric CO₂ until the suggested maximum of 1500 to 1700 ppmv would take many centuries. Many adaptations of the Earth system such as the circulation patterns of air (i.e. wind systems) and water (i.e. ocean currents) will take a long time to adapt to the new situation, and consequently, so will climates. And soil formation also takes many centuries,50 which further delays the emergence of new, more or less stable ecosystems.
Obviously, there are so many uncertainties involved that it really is impossible to predict how long stage 2 will last exactly, so the 40th century “birthdate” of stage 3 of the anthropocene is just a rough guess. More important than that date, however, (and what I intended to figure out) is what the world in the beginning of stage 3 would be like.
Life in the 40th century
Based on the foregoing, a rough map of the inhabitable parts of the Earth in the 40th century can be drawn. The figure below shows such a map for the northern hemisphere. (Click HERE to open a larger version in a separate screen.) For reasons explained below, I haven’t drawn a similar map of the south. As mentioned, this is a rough map – there are undoubtedly many errors in it, and many things will turn out differently. Lakes are mostly copied from the present situation, for example, not taking future precipitation patterns into account.51 However, given the uncertainties involved, there really is no point in trying to make a more detailed or more precise map.
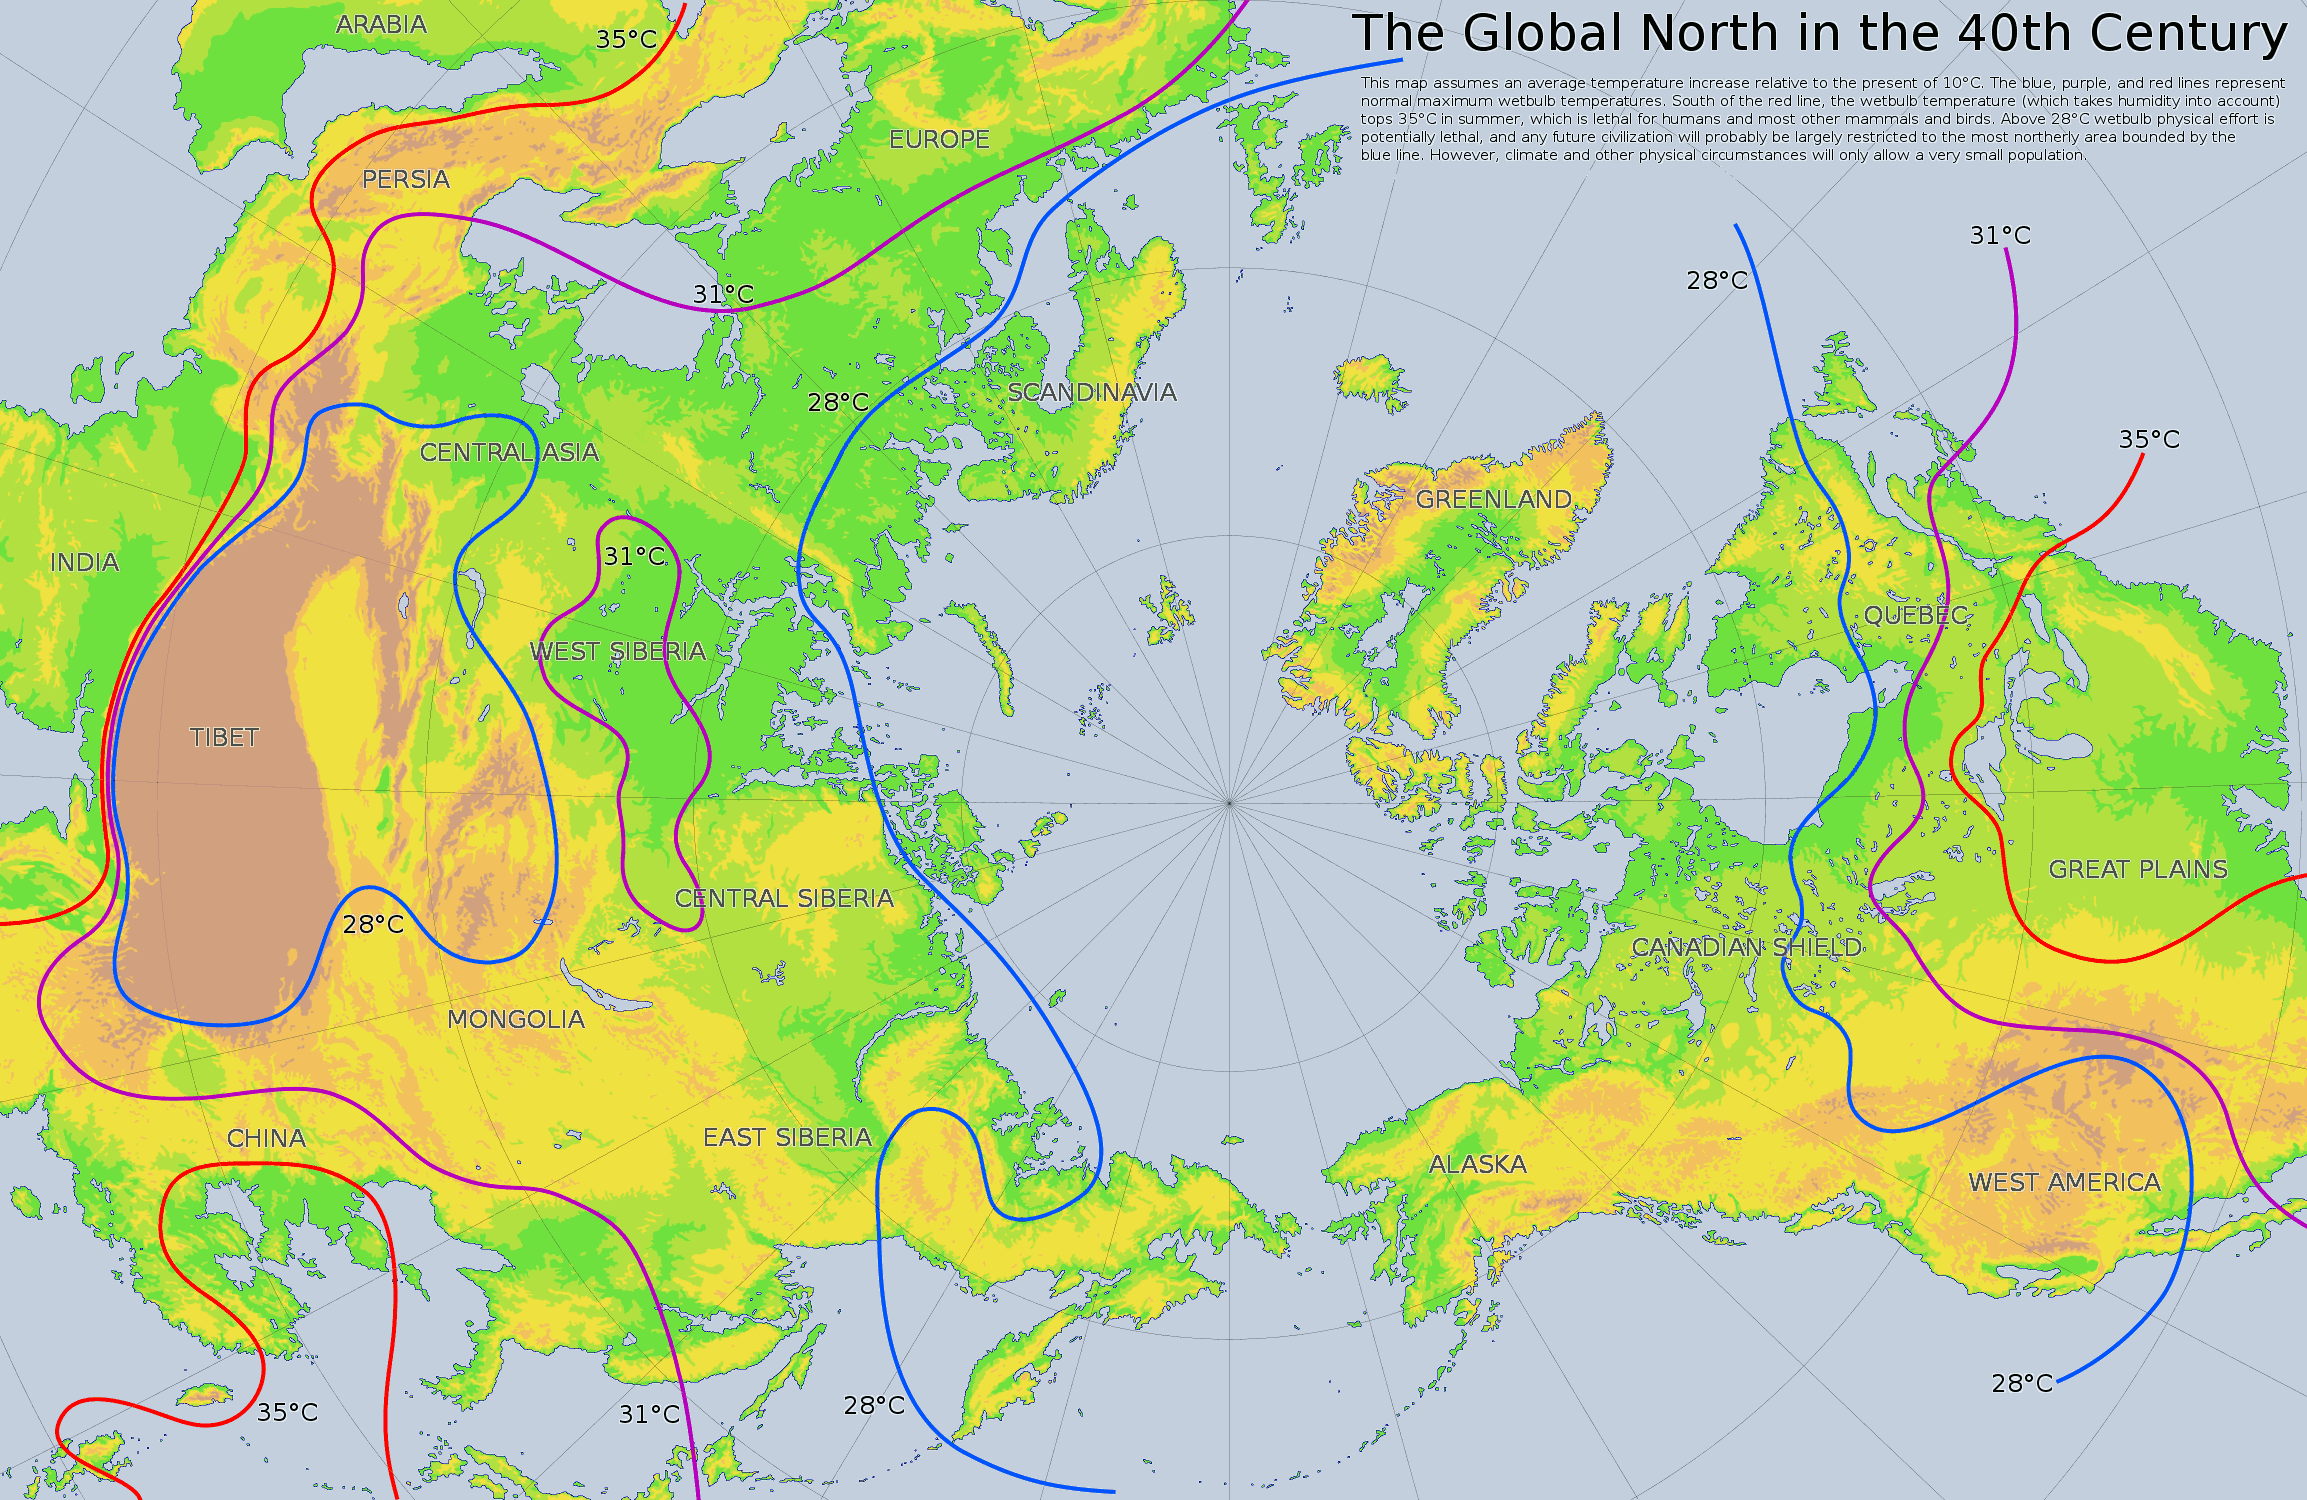 Perhaps, the most obvious way this map deviates from more “typical” maps is in its projection. Given the fact that life will move north, this is the projection that least distorts the main habitable parts of the planet in the 40th century. Partially, I have also chosen this projection and map orientation (with Europe “upside down”) to increase disorientation – emphasizing that this is really a very different world than the one we are used to.
The second most obvious difference concerns shore lines. The above map assumes a 40 to 50m sea level increase, which is compensated in some areas (parts of Canada, Greenland, and Scandinavia) by post-glacial rebound. And of course, Greenland’s ice cap is gone. What is not taken into account, by the way, is sedimentation and the formation of new river deltas. Some of the coast forms will be very different from this map because of those, but it is rather difficult to predict that.
By far the most important map feature is the set of colored lines. These lines represent normal maximum wetbulb isotherms. All areas south of the red line (on this map) experience wetbulb temperatures over 35°C in normal summers. The purple line is the 31°C wetbulb isotherm, and the blue line that of 28°C. In a “normal” summer most human and other mammalian and avian life south of the red line will be exterminated. In practice, however, the purple line represents the outer limit of the inhabitable region(s). Any physical activity at such high wetbulb temperatures is potentially lethal, and at 31°C many weaker individuals (such as the elderly) will die even without doing anything. Much the same is true for animals, moreover, so beyond the purple line, herds would be thinned year after year. Furthermore, this 31°C maximum refers to “normal” summers, but not every summer will be “normal”, and a once-in-a-decade heatwave approaching 35°C will kill off almost everyone.
The conditions between the blue and the purple line are only marginally better. Normal summers reach wetbulb temperatures higher than what is common in the hottest parts of India now, and occasional heatwaves will kill significant parts of the human and animal population. Furthermore, most of these areas are too hot,52 too dry, or otherwise unsuitable for agriculture. Hence, between the blue and purple lines a nomadic lifestyle is possible in regions where the ecosystem can feed grazing animals, and provided that the nomads can protect themselves and their herds from summer heat, but – outside a few more suitable pockets – not much more than that.53
If there is anything resembling “civilization” in the 40th century, it would have to be within the blue line, but even this area is quite inhospitable. There are two kinds of areas with a normal maximum wetbulb temperature below 28°C. The first kind has (very) high air temperatures, but much lower wetbulb temperatures due to very low humidity. These areas are basically deserts. Human life is possible there near sources of water, but the populations of these areas will be very small. The largest area of this kind includes Tibet, parts of Central Asia and Mongolia, and the regions enclosed by that triangle (i.e. the large area enclosed by a blue line in the left of the map). The second largest consists of much of the western half of the United States (i.e. the area labeled “West America” on the map).
For the second kind of area within the blue line it isn’t humidity but temperature that is the decisive factor. These areas are located in the far north. They include Greenland, parts of Canada, parts of East Siberia, northern Russia, Scandinavia, and the British isles. (If, however, the Atlantic meridional overturning circulation, and thus the Gulf stream, switches back on, then the British isles and southern Scandinavia will become too hot and will fall outside the blue line.) This is the main inhabitable zone in the 40th century. For convenience, I will call it the “blue zone” hereafter.54
Because the blue zone is in the far north it will receive very little sunlight in winter, and lots in summer (some regions will experience no day during parts of winter and no night during parts of summer). Because of that, it will have very cold winters and very hot summers. Even within the blue zone, normal summer temperatures will exceed those that are common in the temperate and subtropical zones now. And winter temperatures of –20°C and much below will be no exceptions. This extreme seasonal difference has important implications. Firstly, there will be no food production in winter, so all food has to be produced and stored in the rest of the year. Secondly, the summer is probably too hot for most grains and many other crops that are essential in current diets.55 (Soy beans may be fine, however.) And thirdly, because of the cold winters, the deep permafrost will not melt in many of these areas, leading to bad drainage or even waterlogged soils, severely limiting agriculture. Consequently, agriculture will be characterized by short growing seasons and frequent crop failures, and will, therefore, only be able to feed a relatively small population.
Unfortunately, there is no alternative source of food. Lakes and rivers will probably contain some fish, but won’t be able to feed many, and the oceans will be mostly devoid of fish. The latter is a consequence of ocean acidification, which is the second major effect of high CO₂ concentrations in the atmosphere. CO₂ dissolves in sea water and becomes carbonic acid, which dissolves corals, shells, and much else. Coral reefs are expected to die within the current century, and as approximately a quarter of sea animals depend directly or indirectly on coral reefs, this will cause a mass extinction of ocean life. Plankton is also affected by acidification, moreover, and feeds many marine species that aren’t dependent on coral reefs. Dying ecosystems will be replaced mostly by algae. The worst case scenario is that this leads to massive dead zones in the ocean. Dead zones have insufficient oxygen to sustain animal life and produce poisonous hydrogen sulfide. Potentially, the hydrogen sulfide produced by such dead zones could kill almost all life on Earth, but this is unlikely to happen at the CO₂ levels projected here. Nevertheless, the oceans will be inhospitable and won’t be a source of food, so surviving humans will probably stay away from the coast. (Not in the least because the slimy algae that may dominate future marine ecosystems wash up on shore and decompose into a smelly, poisonous goo.)
On the other hand, there are various natural resources, including iron ore, in the blue zone, so its inhabitants won’t be condemned to neolithic conditions. Levels of technology might be similar to those in the Middle Ages and trade between the various regions might promote the exchange of knowledge. Population size presents a limit to the speed of development, however. If Medieval France could serve as a benchmark, then taking the aforementioned difficulties for agriculture and the dead oceans into account, the blue zone could be inhabited by something like 100 million people (i.e. less than 1.5% of the current world population). Less people and less population density means less ideas and less exchange of ideas, so any progress in this future world will be extremely slow. To what extent they will have access to scientific and other ideas developed by us and our ancestors is a difficult question, but considering the mayhem that will inevitably be associated with the collapse of our way of life in the coming century, it is very likely that very little will be left. And much of what may be left after the mayhem won’t survive the two millennia of slightly lesser chaos of stage 2 of the anthropocene. (It is hard to exaggerate the chaos that awaits us, by the way. Much of India and China will become uninhabitable during this century, leading to mass death and mass migration, for example. And as more and more areas descend into disorder or are even vacated, more and more of the things we built and created will turn to ruin. Not all of them will deteriorate peacefully or gradually, moreover. Nuclear power plants, for example, need to be maintained even after they are deactivated. Lacking such maintenance “nuclear accidents” will follow.) Culturally it will also be a very different world. The people of the 40th century will speak different languages and adhere to different religions. Undoubtedly, the catastrophe that is still in our near future will have become a source of myths and legends for them, like the Great Flood in Jewish/Christian/Muslim mythology.
Thus far, I have only sketched what will be left for humans in the north. It would be possible to draw a map similar to the one above for the southern hemisphere, but it is hardly worth the effort. The southern blue zone would include a small part of southern Chile and Argentina, and part of Antarctica. Much of the rest of Chile would be within the red or even purple line, but that is because it will be a desert. And a small part of New Zealand will be within the purple line as well, but if any humans survive stages 1 and 2 there, the population will be too small and too isolated to survive long into stage 3 of the anthropocene. Part of Antarctica will still be covered with an ice cap, and the problems for agriculture mentioned above will be even more severe in the non-ice-covered parts of Antarctica than in the global north. For these reasons, at most a few million people can survive in the southern blue zone. They will, moreover, be completely isolated from the northern blue zone, as it will be impossible to travel from south to north (or the other way around) without passing a zone of deadly heat.
Much of what applies to humans also applies to other mammals and birds, by the way (except that neither practices agriculture or fishing, of course). Hence, there won’t be much if any mammalian and avian life beyond the purple and red lines. Many insects will also go extinct in the “red zone” (the area beyond the red line until a similar red line in the southern hemisphere).56 Not all plants are equally heat-resistant either. Consequently, whatever lives in the red zone will be very differently from what inhabits the tropics now. Eventually species will adapt (by becoming smaller, for example) and re-enter this zone, but that will take many millennia.
Unless some fundamental change in the Earth system keeps Earth warm, eventually it will start to cool down again, and if humans are still around at that time – tens of thousands of years in the future – they will have another chance of building a civilization. Perhaps, they’ll avoid some of our errors, or perhaps history will just repeat itself. But it is far from improbable that – given the harsh conditions of stage 3 of the anthropocene – that we don’t even reach the post-anthropocene and just very slowly fade out.57
Alternative futures
The future sketched above is the most probable future, but it is not the only possible future. Life on Earth could be extinguished by a collision with a large meteor before any of this plays out, for example, but even if we ignore such cosmic catastrophes, there still are other alternative futures. One was already mentioned above: large-scale nuclear war early in the 21st century. In addition to that scenario, I can think of only one other alternative future, but that one also starts with war. Hence, unless I’m seriously mistaken, the alternative for the miserable non-future sketched above is war.
A large-scale nuclear war in the first half of the current century would lead to a nuclear winter killing most – but almost certainly not all – human (and other animal!) life on Earth, but after a quarter century the effects of nuclear winter (which itself last only a few years) would have passed and Earth returns to “normal”. CO₂ levels would not increase substantially anymore, but would already be high enough to ensure at least 3°C global warming. Adding various feedback effects (see above), total warming would be close to 6°C, however. Such a temperature increase still makes large parts of the planet uninhabitable. The densest populated parts of India and China, for example, would be much too hot to sustain human life. And the other “war scenario” would lead to roughly similar results. In other words, the best case scenario leads to only 6°C warming or so, but those six degrees will already be enough to make a part of the planet that is now inhabited by over two billion people uninhabitable.
Climate change cannot be stopped (or even slowed) peacefully. Protesting against climate change is like praying for someone who is sick (or praying for the victims of a disaster): it makes the person protesting/praying feel good because they convinced themselves that they did something, but really they didn’t do anything. Like praying for a cure, protesting for climate policy is self-serving self-deception. As long as those who make the key decisions are not directly affected, as long as they can hide in their fortified, air-conditioned villas, nothing substantially will change. Change only comes if refusing change becomes more costly (personally and financially) to those in power. Nothing was ever achieved in history by politely asking for it. The global elites will only seriously consider fighting climate change if their refusal to do so becomes so costly to them personally and financially that they are effectively forced to. That cannot be achieved without violence. That requires a war. (That requires a “zombie uprising”.)58 This is the aforementioned “other war scenario”.
Liberals, centrists, and other moderates will probably consider the last paragraph “extremist”, but that only illustrates the extent of their blindness.59 Imagine someone locked into a room. Outside the room there is someone else who is in control of the room’s thermostat. He keeps raising the temperature, effectively changing the room into an oven, which will eventually kill the person inside. The liberal or moderate would apparently consider it too extreme to force the second person’s hand of the thermostat. For a moderate, anything beyond politely asking is too extreme. But that’s absurd. There isn’t a single person in the room, but billions. Even if we act soon, hundreds of millions of people will have to be helped migrating and resettling in other parts of the planet. The alternative is just letting them die. Even more – it is not really a case of just “letting them die”. Earth’s temperature is knowingly and willingly raised (because it is still profitable to do so). Who exactly the perpetrators are and who are mere accomplices is hard to say,60 but that doesn’t change the fact this is not just “letting die”: it is murder. Some of us are murdering billions. It is a slow murder – it will start with heat waves killing “only” hundreds of thousands, getting worse and worse year after year until the numbers of absolute deaths start falling again because fewer and fewer people are left alive. But a slow mass murder is still a mass murder.
Thus far, the response of the global elite has been to use their control of the press and of politics to promote nationalism and xenophobia. Rather than helping the victims of climate change, they are promoting the building of armed fortresses, fences, and walls. The victims are locked outside, forced to die where they lived. They are the person locked in the room with the global elite controlling the thermostat outside. Consenting to (or even supporting) the building of walls (even if they are just legal walls) is being accomplice to mass murder.
Using whatever force necessary to get the psychopath away from the thermostat is not “extremism”. Murdering billions, or letting them die, or being an accomplice to that, or even just politely protesting against that – that is extremism.
So, there still are alternative futures, but they require war, and they are dark futures (and not just because they require war). But there aren’t many options left. The next century will be one of increasing chaos and collapse, regardless of the path that we’ll collectively choose. If we don’t do anything, then before the end of the century India and China will be dead and much of the rest of the planet will be embroiled in wars over water and/or devastated by disasters and refugee flows. If we choose war and the “good side” wins, the situation will still be harsh. Hundreds of millions will have to be relocated,61 strict birth control policies will have to be enforced,62 and so forth. In either case, the future is bleak. But there are gradations of bleakness.
Postscript (March 19th, 2019) – An attempt to predict the nearer future in On the Fragility of Civilization lead to the conclusion that global societal collapse is likely to occur within half a century (and probably before 2050), which would lead to much lower total CO₂ emissions, less heating, and less (extreme) feedback effects. This in turn would imply that a larger part of the planet will remain inhabitable. Perhaps even enough for half a billion people.
If you found this article and/or other articles in this blog useful or valuable, please consider making a small financial contribution to support this blog 𝐹=𝑚𝑎 and its author. You can find 𝐹=𝑚𝑎’s Patreon page here.
Notes
- But there are exceptions, of course, and we’ll encounter some of those exceptions below. Perhaps, the most prominent exception is the 2013 IPCC report that looks forward until the 30th century in chapter 12.
- This doesn’t mean that these models are supposed to replace the RCPs. Rather, their purpose is to supplement them. The two kinds of models also have a very different focus and scope. RCPs are climate science models; SSPs are social science models.
- The following sketches are mostly based on: Keywan Riahi et al. (2017), “The Shared Socioeconomic Pathways and their energy, land use, and greenhouse gas emissions implications: An overview”, Global Environmental Change 42: 153-168.
- (1) Rob Dellink, Jean Chateau, Elisa Lanzi, & Bertrand Magné (2017). “Long-term economic growth projections in the Shared Socioeconomic Pathways”, Global Environmental Change 42: 200-214. (2) Marian Leimbach, Elmar Kriegler, Niklas Roming, & Jana Schwanitz (2017). “Future growth patterns of world regions – A GDP scenario approach”, Global Environmental Change 42: 215-225. (3) Jesús Crespo Cuaresma (2017). “Income projections for climate change research: A framework based on human capital dynamics”, Global Environmental Change 42: 226-236.
- Keywan Riahi et al. (2017), “The Shared Socioeconomic Pathways and their energy, land use, and greenhouse gas emissions implications: An overview”, Global Environmental Change 42: 153-168, p. 156.
- Dellink et al. (2017), p. 202.
- By far the most thorough analysis of the nonsense propounded by neoclassical economics can be found in Steve Keen’s Debunking Economics (Revised and Expanded edition; London: Zed Books, 2011). See also Economics as Malignant Make Believe.
- Steve Keen – see previous note – was one of the few (non-mainstream!) economists predicting that crisis, by the way.
- For a more detailed critique, see the two sources mentioned two notes before this one.
- Marian Leimbach, Elmar Kriegler, Niklas Roming, & Jana Schwanitz (2017). “Future growth patterns of world regions – A GDP scenario approach”, Global Environmental Change 42: 215-225. (3) Jesús Crespo Cuaresma (2017). “Income projections for climate change research: A framework based on human capital dynamics”, Global Environmental Change 42: 226-236.
- Hyman Minsky is the most famous, but I recommend the following two books: Michael Hudson (2015), Killing the Host: How Financial Parasites and Debt Bondage Destroy the Global Economy (Petrolia: Counterpunch Books); and Steve Keen (2017). Can We Avoid Another Financial Crisis? (Cambridge: Polity). See also Rent, Debt, and Power.
- See the sources mentioned in the previous note for further details.
- On the demise of capitalism, see also: Wolfgang Streeck (2016), How Will Capitalism End?: Essays on a Failing System (London: Verso).
- Erik S. Reinert (2007). How Rich Countries Got Rich…and Why Poor Countries Stay Poor (London: Constable).
- And simultaneously hides the most parasitic elements.
- For further details, see Rent, Debt, and Power.
- Håvard Hegre et al. (2016). “Forecasting civil conflict along the shared socioeconomic pathways”, Environmental Research Letters 11.5: 054002.
- p. 3
- This is a slight exaggeration, obviously. Other things matter as well, but the sum of CO₂ emissions is so much more important for the Earth’s climate in the long run than anything else we do that is is only a very slight exaggeration.
- Figure 5, p. 162, in: Riahi et al. (2017).
- See pages 1102-3, and figure 12.42.
- See, for example: Tobias Böhmelt (2017), “Employing the shared socioeconomic pathways to predict CO₂ emissions”, Environmental Science and Policy 75: 56-64.
- See also: Crisis and Inertia (4) – Economic, Political, and Cultural Crises.
- Christian Parenti (2011). Tropic of Chaos: Climate Change and the New Geography of Violence (Nation Books). Joel Wainwright & Geoff Mann (2018). Climate Leviathan: A Political Theory of Our Planetary Future (London: Verso).
- See Rent, Debt, and Power.
- Camilo Mora et al. (2018). “Broad Threat to Humanity from Cumulative Climate Hazards Intensified by Greenhouse Gas Emissions”, Nature Climate Change.
- He assumed that the glaciers of the Himalaya melt much faster than they actually do, or than what even is possible. Gwynne Dyer (2010). Climate Wars: The Fight for Survival as the World Overheats (Oxford: OneWorld).
- But incompetent and ignorant political leaders pose a serious risk, of course.
- See: Owen Toon, Alan Robock, & Richard Turco (2008), “Environmental Consequences of Nuclear War”, Physics Today December 2008: 37-42; and: Adam Liska, Tyler White, Eric Holley, and Robert Oglesby (2017), “Nuclear Weapons in a Changing Climate: Probability, Increasing Risks, and Perception”, Environment 59.4: 22-33. See also: Crisis and Inertia (3) – Technological Threats and Crises.
- Jonathan Proctor, Solomon Hsiang, Jennifer Burney, Marshall Burke, & Wolfram Schlenker (2018). “Estimating Global Agricultural Effects of Geoengineering Using Volcanic Eruptions”, Nature, August 8.
- Or it might be India and China, two countries that will be hit hard by deadly heatwaves early in the current century, who start SRM. See below.
- The classic study on tipping points (Lenton et al. 2008) suggests that warming in the range of 3 to 5°C triggers most tipping elements. Drijfhout et al. (2015, fig. 4) suggests about two thirds are triggered at temperature increases below 3°C. See: Timothy Lenton et al. (2008), “Tipping Elements in the Earth’s Climate System”, PNAS 105.6: 1786-1793; and Sybren Drijfhout et al. (2015), “Catalogue of Abrupt Shifts in Intergovernmental Panel on Climate Change Climate Models”, PNAS: E5777-E5786.
- David Thornalley et al. (2018). “Anomalously weak Labrador Sea convection and Atlantic overturning during the past 150 years”, Nature 556: 227–230.
- IPCC (2013), Climate Change: The Physical Science Basis, p. 520.
- Will Steffen et al. (2018). “Trajectories of the Earth System in the Anthropocene”, Proceedings of the National Academy of Sciences (PNAS) 115.33: 8252-8259.
- Richard Betts, Michael Sanderson, and Stephanie Woodward (2008). “Effects of large-scale Amazon forest degradation on climate and air quality through fluxes of carbon dioxide, water, energy, mineral dust and isoprene”, Philosophical Transactions of the Royal Society B 363: 1873-1880.
- Gordon Bonan (2008). “Forests and Climate Change: Forcings, Feedbacks, and the Climate Benefits of Forests”, Science 320: 1444-1449.
- T. Schneider von Deimling et al. (2012). “Estimating the near-surface permafrost-carbon feedback on global warming”, Biogeosciences 9: 649-665.
- Will Steffen et al. (2018). “Trajectories of the Earth System in the Anthropocene”, Proceedings of the National Academy of Sciences (PNAS) 115.33: 8252-8259, p. 8253.
- Bill McGuire (2002). A Guide to the End of the World (Oxford: OUP).
- See, for example: James Hansen, Makiko Sato, & Pushker Karechka (2012), “Climate Sensitivity, Sea Level and Atmospheric Carbon Dioxide”, Philosophical Transactions of the Royal Society A 371, 0294; David Kidder & Thomas Worsley (2012). “A Human-Induced Hothouse Climate?”, GSA Today 22.2: 4-11; and Colin Goldblatt & Andrew Watson (2012), “The Runaway Greenhouse: Implications for Future Climate Change, Geoengineering and Planetary Atmospheres”, Philosophical Transactions of the Royal Society A 370: 4197-4216.
- See, for example: Caspar Hallman et al. (2017), “More than 75 Percent Decline over 27 years in Total Flying Insect Biomass in Protected Areas”, PLOS One 12.10: e0185809; Bradford Lister & Andres Garcia (2018), “Climate-Driven Declines in Arthropod Abundance Restructure a Rainforest Food Web”, PNAS 115.44: E10397-E10406; and Kris Sales et al. (2018), “Experimental Heatwaves Compromise Sperm Function and Cause Transgenerational Damage in a Model Insect”, Nature Communications 9: 4771.
- James Hansen, Makiko Sato, & Pushker Karechka (2012), “Climate Sensitivity, Sea Level and Atmospheric Carbon Dioxide”, Philosophical Transactions of the Royal Society A 371, 0294; David Kidder & Thomas Worsley (2012).
- David Kidder & Thomas Worsley (2012). “A Human-Induced Hothouse Climate?”, GSA Today 22.2: 4-11. See especially figure 5.
- On the importance of the sun (or “total solar irradiance”) in this kind of comparison, see for example: Gavin Foster, Dana Royer, & Daniel Hunt (2017). “Future Climate Forcing Potentially without Precedent in the last 420 Million Years”, Nature Communications 8: 14845.
- Ricarda Winkelmann, Anders Levermann, Andy Ridgwell, & Ken Caldeira (2015). “Combustion of Available Fossil Fuel Resources Sufficient to Eliminate the Antarctic Ice Sheet”, Science Advances 1.8: e1500589.
- Winkelmann et al. (2015), figure 1D.
- About Greenland, see: Shfaqat Khan et. al. (2016), “Geodetic measurements reveal similarities between post–Last Glacial Maximum and present-day mass loss from the Greenland ice sheet”, Science Advances 2.9: e1600931.
- Steven Sherwood & Matthew Huber (2010). “An Adaptability Limit to Climate Change Due to Heat Stress”, PNAS 107.21: 9552-9555
- V.O. Targulian & P.V. Krasilnov (2007). “Soil System and Pedogenic Processes: Self-Organization, Time Scales, and Environmental Significance”, Catena 71: 373-381.
- Except for lakes in areas that will be very hot and very dry and that are, therefore, unlikely to remain.
- J.L. Hatfield et al. (2011). “Climate Impacts on Agriculture: Implications for Crop Production”, Agronomy Journal 103.2: 351-370.
- There are various reasons why some area might be a “more suitable pocket”. There may be nearby mountains as a summer refuge. Or there may be a microclimate that shelters the region from the extreme heat of surrounding regions. Or there may be a mountain range creating a rain shadow and thus drought in the hottest part of summer. And so forth.
- The aforementioned “more suitable pockets” outside the blue line but within the purple line could also be considered to be part of the blue zone.
- Hatfield et al. (2011). “Climate Impacts on Agriculture”.
- On insect extinction, see just above the “How Hot?” sub heading.
- A minor cosmic disaster such as a meteor impact or even a serious epidemic might be enough to kill the small human population left in stage 3 of the anthropocene. Given that this stage will last for ten-thousands of years, the odds of that small population surviving into the distant future don’t seem good, but then again, we are a flexible and highly adaptive species.
- Because most of us are as disposable and sub-human in the eyes of the elite as zombies. We, in fact, are zombies. See: You Are a Zombie.
- It is an ideologically motivated blindness, unfortunately, and therefore, hard to cure.
- But it is absurd to say that all of mankind is to blame for climate change (as centrists and other defenders of the status quo sometimes do). Most of the anthropogenic CO₂ in the atmosphere has been produced by a very small (and very wealthy) minority.
- This will be expensive, of course, but it can probably be funded by confiscated the ill-gotten gains of the global financial and industrial elite.
- And with “strict” I mean strict. Any infant born over the necessary one-child-per-couple limit will have to be killed at birth if pregnancy isn’t aborted before that.