Climate scientists have been calling recently for more research into warming scenarios of 3°C and above because such scenarios are dangerously neglected.1 According to mainstream models such levels of warming are by no means impossible or even unlikely, and would have catastrophic effects. Luke Kemp and ten colleagues write:
Could anthropogenic climate change result in worldwide societal collapse or even eventual human extinction? At present, this is a dangerously underexplored topic. Yet there are ample reasons to suspect that climate change could result in a global catastrophe.2
The answer to the question in this quote is obviously “yes”, but that’s not a very useful answer. That something is hypothetically possible doesn’t mean it is likely. A more important question is how probable it is that climate change leads to “worldwide societal collapse”, or in other words, to the end of civilization. (I’ll ignore the human extinction scenario here.) If we’d have a reliable probability distribution of the maximum temperature anomaly (i.e. global warming) in the 20th century, and another probability curve that shows the probability of global societal collapse at every level of warming (ignoring other possible causes of the end of civilization!), then answering this question is almost trivially easy – all it requires is “multiplying” those two curves.
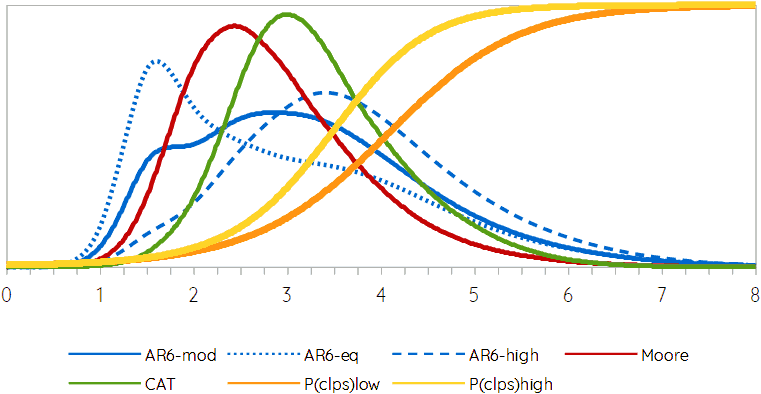
So, do we have those two curves? The answer to that question is less clear, unfortunately. The latest cycle of IPCC reports (AR6)3 mostly uses five different scenarios (based on the SSPs), but these aren’t all equally likely. And in addition to those, there are many other models and predictions. Furthermore, there is no published probability curve or equation that predicts the probability of global societal collapse at different levels of warming. We can estimate the latter, however. Arguably, this should be an S-shaped curve (such as a cumulative logistic distribution function) with a value close to 0% at the current level of global warming (1.1 or 1.2°C) and a value close to 100% at 6°C or more of warming, considering that the handful of studies that do consider such extreme scenarios all strongly suggest that civilization won’t be able to cope with that, and even that human extinction would become a significant risk (if not likely).4 This still leaves room for considerable variation, but that can be dealt with by using more “optimistic” and “pessimistic” variants, such as the orange and yellow lines in the following figure, respectively.
 Perhaps, this “pessimistic” variant (i.e. the yellow line) is still much too optimistic, however. Even the effects of 2°C warming as spelled out in the IPCC’s special report on 1.5°C of warming5 (which explicitly compares the effects of 1.5°C and 2°C) and other relevant studies may be sufficient to set up a cascade of “natural” disasters (including widespread and severe drought), famines, refugee flows (in the hundreds of millions, perhaps even exceeding a billion people), economic crisis and the collapse of international trade (leading to resource scarcity and further economic decline), and societal collapse that could envelop the whole planet in a matter of decades. How large these risks really are is difficult to judge (except at low confidence levels) due to a lack of relevant research. As mentioned, climate scientists insufficiently investigate more “extreme” scenarios, but social scientists don’t seem to take climate change seriously at all. And importantly, studying the likely social, economic, and political effects of climate change isn’t climate science – this is social science. (I’ll return to this topic below.)
In addition to the yellow and orange probability curves (which range from 0% to 100% on their y-axis) there are five other lines in the figure (that have their own y-axis). These five lines show the probability distributions for different levels of warming in different (collections of) scenario(s). (The surfaces below these five probability distributions are all 1 – i.e. 100%.)
The three blue curves are based on the five prominent scenarios in the IPCC’s AR6 (2021-2022):
| scenario | Δtmax | |
| SSP1-1.9 | 1.6°C | Taking the green road — Gradual shift toward sustainability and environmental protection. Emphasis on human well-being instead of economic growth. More international cooperation; less inequality. |
| SSP1-2.6 | 1.7°C | Idem. But slightly slower. |
| SSP2-4.5 | 2.7°C | Middle of the road — More or less a continuation of the present situation. |
| SSP3-7.0 | 3.6°C | A rocky road — Increasing nationalism and conflict. Growing concerns about security (including food security!) and competitiveness. Less international cooperation; more inequality. |
| SSP5-8.5 | 4.4°C | Taking the highway — Focus on economic growth and free trade. Investment in innovation, education, etc. Continuing dependence on fossil fuels. Environmental problems managed by means of technology. |
There is no SSP4 scenario in this list – perhaps, because the IPCC is an intergovernmental organization and governments don’t like SSP4, which is (more or less) a more extreme version of SSP3. Arguably, SSP3 is the direction the world is moving into, so probably that scenario is the most likely. Nevertheless, even that scenario is improbable because the SSPs are unrealistic by design. This may not be immediately obvious, but the economic foundations of the SSPs are provided by a model that is based on an explicit rejection of real-world patterns and relations in favor of abstraction and idealization – that is, an economic model that proclaims that economic crisis is impossible, that promises perpetual economic growth, and that has less predictive power than a magic 8-ball.6
Because the five IPCC scenarios are not all equally probable (some of them are exceedingly unlikely, in fact), they should be weighted differently before combining them, but this can be done in different ways. Hence, the three different blue lines. In case of the dotted line (marked AR6-eq) all five scenarios have a probability of 20% (i.e. they are assumed to be equally probable, which is obvious nonsense). In case of the AR6-mod curve, the five scenarios are weighted as 5%, 15%, 30%, 35%, and 15%, respectively, which seems a realistic – albeit still rather “conservative” (or overly cautious) – approach. The remaining (dashed) blue line (AR6-high) gives less weight to the two SSP1 scenarios and more to the SSP3 and SSP5 scenarios.
The red line combines the five predictions in “Determinants of emissions pathways in the coupled climate–social system” (2022) by Frances Moore and colleagues (weighted by the probabilities given in that paper).7 Moore et al.’s paper is one of the very few that makes a serious – albeit flawed – attempt to model social feedbacks on emissions.8 Unfortunately, their models rely on science fiction assumptions about residual emissions9 and carbon capture technology10 and are thus overly optimistic, but as there are very few studies that try to take social effects on carbon emissions into account, it seemed worthwhile to include it here.
The green line, finally, shows the temperature probability distribution for the current “policies and action” scenario of the Climate Action Tracker (November 2021) – that is, the expected level of global warming (ca. 2.7°C) if we continue on the current path without significant changes in climate policies and emission reduction efforts.
The graph, then, shows five probability distributions for average global warming, and two probability curves for global societal collapse, resulting in the 5×2=10 different numbers for the likelihood of an end of civilization in the 21st century shown in the following table:
| P(clps)low | P(clps)high | |
| AR6-mod | 31% | 43% |
| AR6-eq | 27% | 36% |
| AR6-high | 41% | 56% |
| Moore | 22% | 32% |
| CAT | 31% | 45% |
Of these various results, the one in the top left is, perhaps, the most conservative (in that it is based on the typical bias among climate scientists to “err on the side of least drama”11). Nevertheless, I was quite surprised by this result. Before doing these calculations, I guessed that such a conservative approach would result in a roughly 15% likelihood of an end of civilization this century, but it is more than double that number. And obviously, a less “conservative” – and probably much more realistic – approach results in a much higher probability.12
There is, however, a fundamental problem with the method of calculating the probability of collapse used here: it assumes independence between the two probability curves that are being “multiplied”, but that assumption is nonsensical. This is illustrated most easily by assuming a collapse curve with an steeper slope than the yellow curve in the figure above. If there is, for example, a 75% probability of global societal collapse at 2°C of average global warming (which is high, but not completely implausible), then that also means that there is a 75% probability that we won’t exceed those 2°C of warming by much, because after civilizational collapse carbon emissions will be reduced to much lower levels, perhaps even approaching pre-industrial levels.13 This kind of feedback effects is what I’m trying to understand by means of the flawed series of models in the SotA-R series. One key conclusion from that series (but see also the last section of my previous article on “fast” emission reduction), is that global societal collapse will probably do more to reduce our carbon emission reduction than any policy or directed effort.
Notwithstanding this interdependence (or feedback) problem, if there is one thing that these simple calculations make clear, it is that the climate scientists calling for more research into 3-plus degrees of warming scenarios are right. We need to know much more about the more (and less) probable implications of such extreme (but unfortunately not improbable) levels of warming. However, this is not just a topic for climate scientists – it must involve social scientists as well. Some climate scientists seem to think that all research that has something to do with climate change is climate science,14 but that is a rather silly mistake. Estimating the effects of droughts on civil unrest, or the effects of the disruption of the global trade network, or refugee flows and their effects, and so forth, is not climate science and climate scientists are not qualified to do or judge such research and its outcomes. (Perhaps, geographers are most qualified, but I may be biased as I am a geographer myself; as well as a philosopher, but that is less relevant here.)
Unfortunately, researching the effects of high levels of global warming and especially more catastrophic scenarios such as societal collapse appears to be taboo in the social sciences. Since the 1970s there has been a steady stream of computer models that predict the collapse of civilization due to pollution, inequality, excessive complexity, or other causes, but these are all highly abstract computer models that do not map directly to the real world. As long as your model is sufficiently abstract, it is acceptable, but predicting climate catastrophe in the real world is not.15 This, of course, needs to change. The social sciences need to take the possibility of societal collapse and the end of civilization seriously. And the same applies to the other sciences, of course. Certainly, this possibility also raises moral (and other philosophical) questions that remain largely unexplored.
If you found this article and/or other articles in this blog useful or valuable, please consider making a small financial contribution to support this blog, 𝐹=𝑚𝑎, and its author. You can find 𝐹=𝑚𝑎’s Patreon page here.
Notes
- Florian Jehn et al. (2021), “Betting on the best case: higher end warming is underrepresented in research”, Environmental Research Letters 16: 084036. Luke Kemp et al. (2022), “Climate Endgame: Exploring catastrophic climate change scenarios”, PNAS 119.34: e2108146119.
- Kemp et al. (2022), “Climate Endgame”: abstract.
- https://www.ipcc.ch/assessment-report/ar6/
- See, for example, Mark Lynas (2020), Our Final Warning: Six Degrees of Climate Emergency (London: 4th Estate).
- https://www.ipcc.ch/sr15/
- This is, of course, entirely in line with standard practice in mainstream economics. Rob Dellink and colleagues, who provided the economic model for the SSPs , wrote: “There is no unified theoretical model of economic growth . . . , and many ways of representing economic growth, and especially technological progress, exist. Macroeconometric models have been popular, but lack a theoretical foundation. They are subject to the Lucas Critique . . . , which states that models that are purely based on historical patterns cannot be used for policy advice, as they lack an explanation of the underlying structural parameters . . .” What this means is that Dellink (and other mainstream economists) assume that a mathematical model that has never been able to predict anything (it predicted continuing economic growth at the beginning of the Great Recession of 2008-2009, for example, and never saw that crisis coming, while several non-mainstream economists did) gives a better “explanation of the underlying structural parameters” than anything that could be learned from doing actual research in the real world. — Rob Dellink, Jean Chateau, Elisa Lanzi, & Bertrand Magné (2017), “Long-term economic growth projections in the Shared Socioeconomic Pathways”, Global Environmental Change 42: 200-214. The quote can be found on p. 202.
- Frances Moore et al. (2022), “Determinants of emissions pathways in the coupled climate–social system” Nature. https://doi.org/10.1038/s41586-022-04423-8
- For my comments on Moore et al.’s paper see: Social Feedbacks and Global Warming.
- Emissions from industrial and other processes for which there is no carbon-neutral alternative available. I estimate this at about 36% at the current state of technology, based on publicly available data for emissions per economic sector and other relevant data. Moore et al. assume that it will reach 0% in a few decades (as do many other studies), which is absurd.
- Removing CO₂ from the atmosphere. Due to the laws of physics this requires more energy than we got when putting that CO₂ in the atmosphere in the first place, and consequently, this can never be done at the scale required to significantly reduce atmospheric CO₂. For this and other reasons, carbon capture from the atmosphere and other “negative emission” technologies were called “magical thinking” in a Nature editorial. (2018,. “Negative thinking”, Nature 554 (22 February), p. 404.) Nevertheless, even the IPCC assumes widespread carbon capture in most of its models.
- Keynyn Brysse, Naomi Oreskes, Jessica O’Reilly, and Michael Oppenheimer (2013). “Climate Change Prediction: Erring on the Side of Least Drama”, Global Environmental Change 23: 327-337.
- If 2°C is indeed sufficient to set of the aforementioned cascade of collapse, then the end of civilization some time in the present century is all but guaranteed.
- A collapse of the international trade network and manufacturing industry will also have severe demographic implications (in addition to the demographic effects of famine and civil war). As Erik Reinert and others have shown, without extensive networks of urbanized manufacturing, an economy can feed a much smaller population. — Erik S. Reinert (2007), How Rich Countries Got Rich…and Why Poor Countries Stay Poor (London: Constable).
- Michael Mann is a good example. In 2019, he denounced a paper in the field of national security studies that looked into national security implications of high levels of global warming. Mann is a climate scientist, however, and it was obvious from his critique that he has no clue about the aims and methods of national security studies, so he was way out of line. — See Michael Mann versus the “Doomists”.
- Jem Bendell’s failed attempt to publish his paper “Deep Adaptation” is probably the best known example of this taboo, but I stumbled upon the same problem myself as well. — Jem Bendell (2018). Deep Adaptation: A Map for Navigating Climate Tragedy, IFLAS Occasional Paper 2. — For my attempt, see: A Theory of Disaster-Driven Societal Collapse and How to Prevent It.